Mechanics: Interpret, evaluate and apply motion of free-falling bodies
Unit 2: Graphs of vertical projectile motion
Dylan Busa
Unit outcomes
By the end of this unit you will be able to:
- Analyse and represent problems on projectile motion as graphs of motion.
- Identify, analyse and solve problems on projectile motion represented in and using graphs of motion.
What you should know
Before you start this unit, make sure you can:
- Describe and identify vertical projectile motion. Refer to unit 1 if you need help with this.
- Describe and apply gravitational potential energy. Refer to level 2 subject outcome 2.3 if you need help with this.
- Use graphs to describe and interpret motion in one dimension including:
- displacement-time graphs
- velocity-time graphs
- acceleration-time graphs.
Refer to level 3 subject outcome 2.1 unit 2 if you need help with this.
- Calculate and interpret the gradient of:
- displacement-time graphs to determine velocity
- velocity-time graphs to determine acceleration.
- Calculate the area of velocity-time graphs to find displacement.
Refer to level 3 subject outcome 2.1 units 2 and 3 if you need help with this.
Introduction
In the previous unit, we learnt about vertical projectile motion and how we can analyse and solve problems about vertical projectile motion using the standard equations of motion. In this unit we will apply what we know about graphs of motion to analyse situations involving vertical projectile motion. Remember, that graphs of motion are just the graphical representations of the equations of motion.
Review graphs of motion
If you need to, now is a good time to revise what we learnt about graphs of motion in level 3 subject outcome 2.1 units 2 and 3. In level 3, we used these graphs of motion to analyse problems related to horizontal motion in one dimension.
Here is a summary of what you should know.
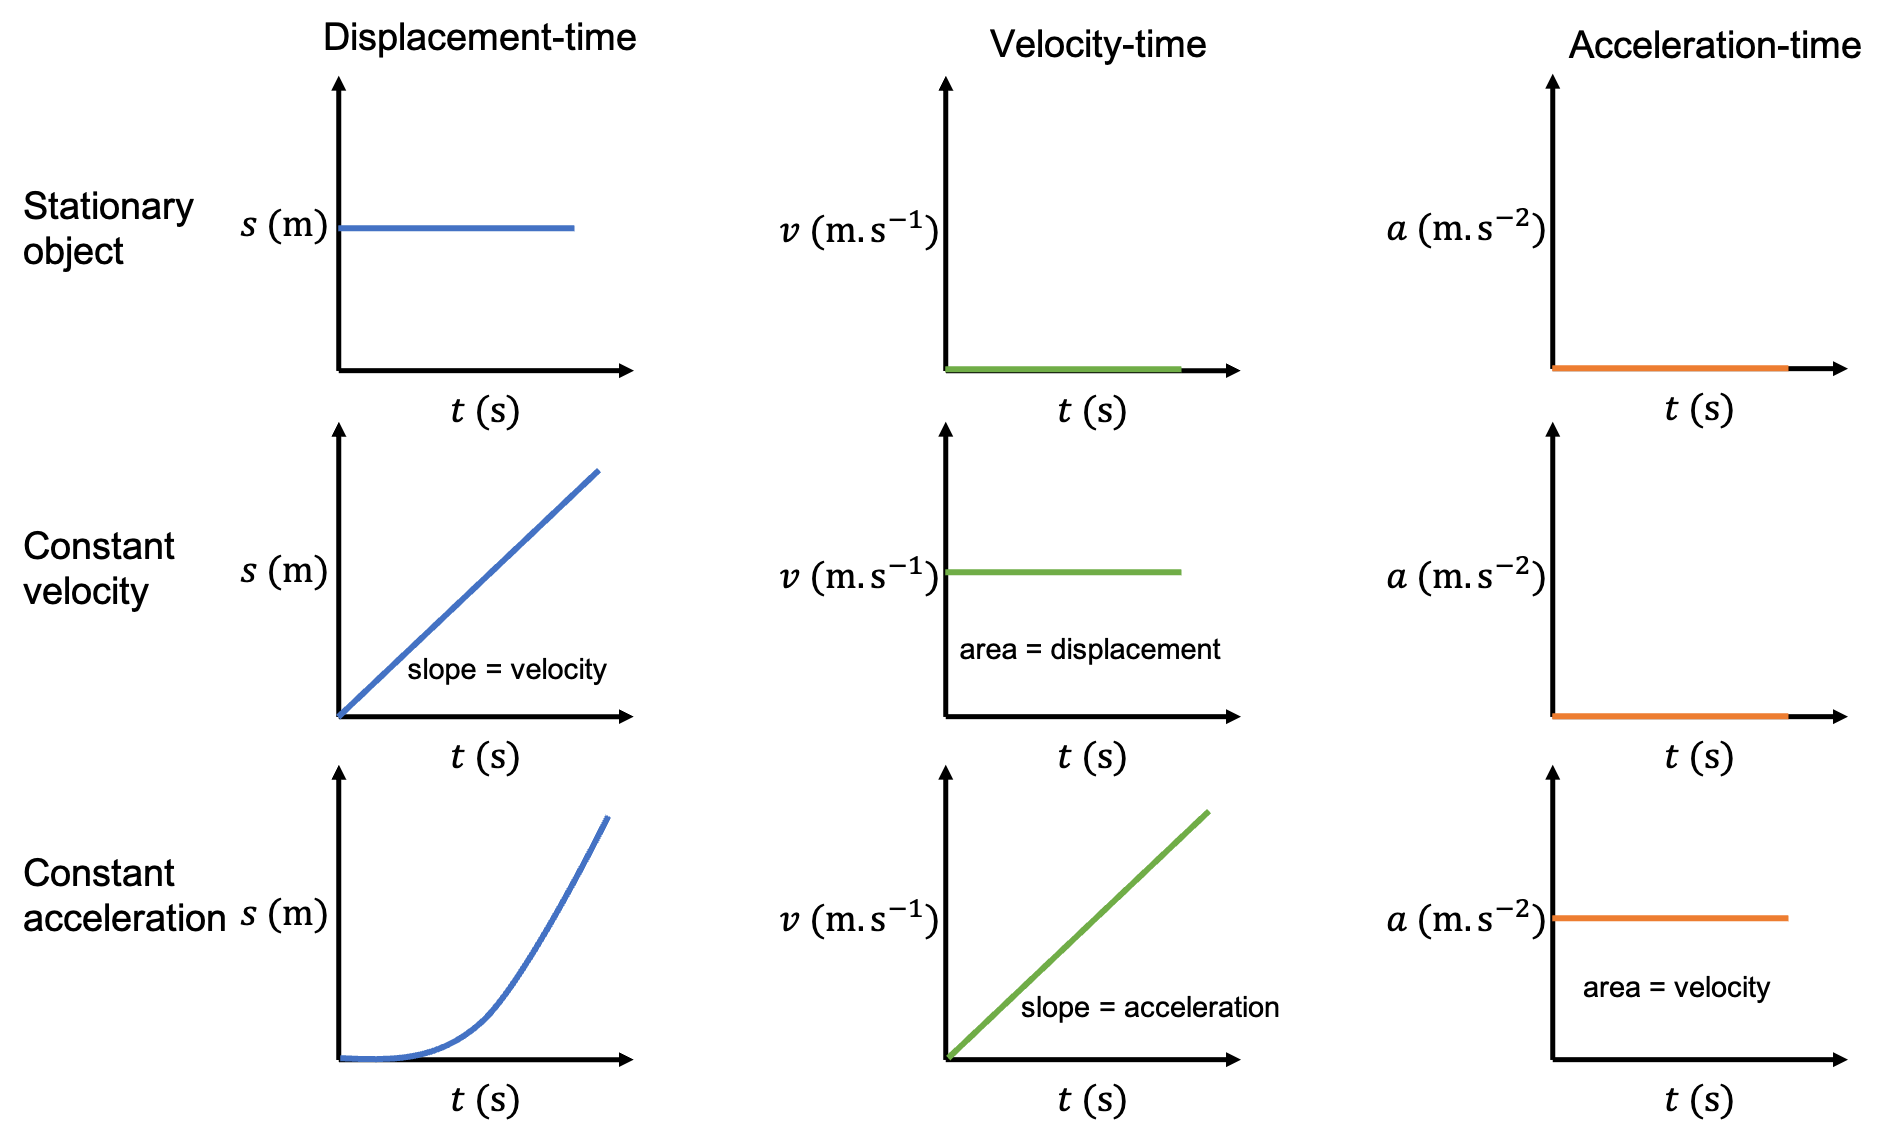
Graphs of vertical projectile motion
Suppose you throw a ball directly up into the air. What do you think the displacement-time graph of this object’s motion will look like as it rises into the air and then falls back down and lands in your hand? Draw a rough displacement-time graph for this motion before reading on. Assume that upwards is positive.
- Initially (at [latex]\scriptsize t = 0~\text{s}[/latex]), the ball will be in your hand and so, relative to your hand, it will have a displacement of [latex]\scriptsize 0~\text {m}[/latex].
- After leaving your hand, the ball travels up and away from your hand while experiencing a constant negative acceleration due to gravity.
- Eventually, the ball will reach its maximum height (its maximum displacement from your hand).
- The ball will then start to fall while continuing to experience the same constant negative acceleration due to gravity.
- Finally, the ball will land back in your hand and so have a final displacement, relative to your hand, of [latex]\scriptsize 0~\text {m}[/latex].
If we were to draw this motion, it would look like the displacement-time graph in figure 2.
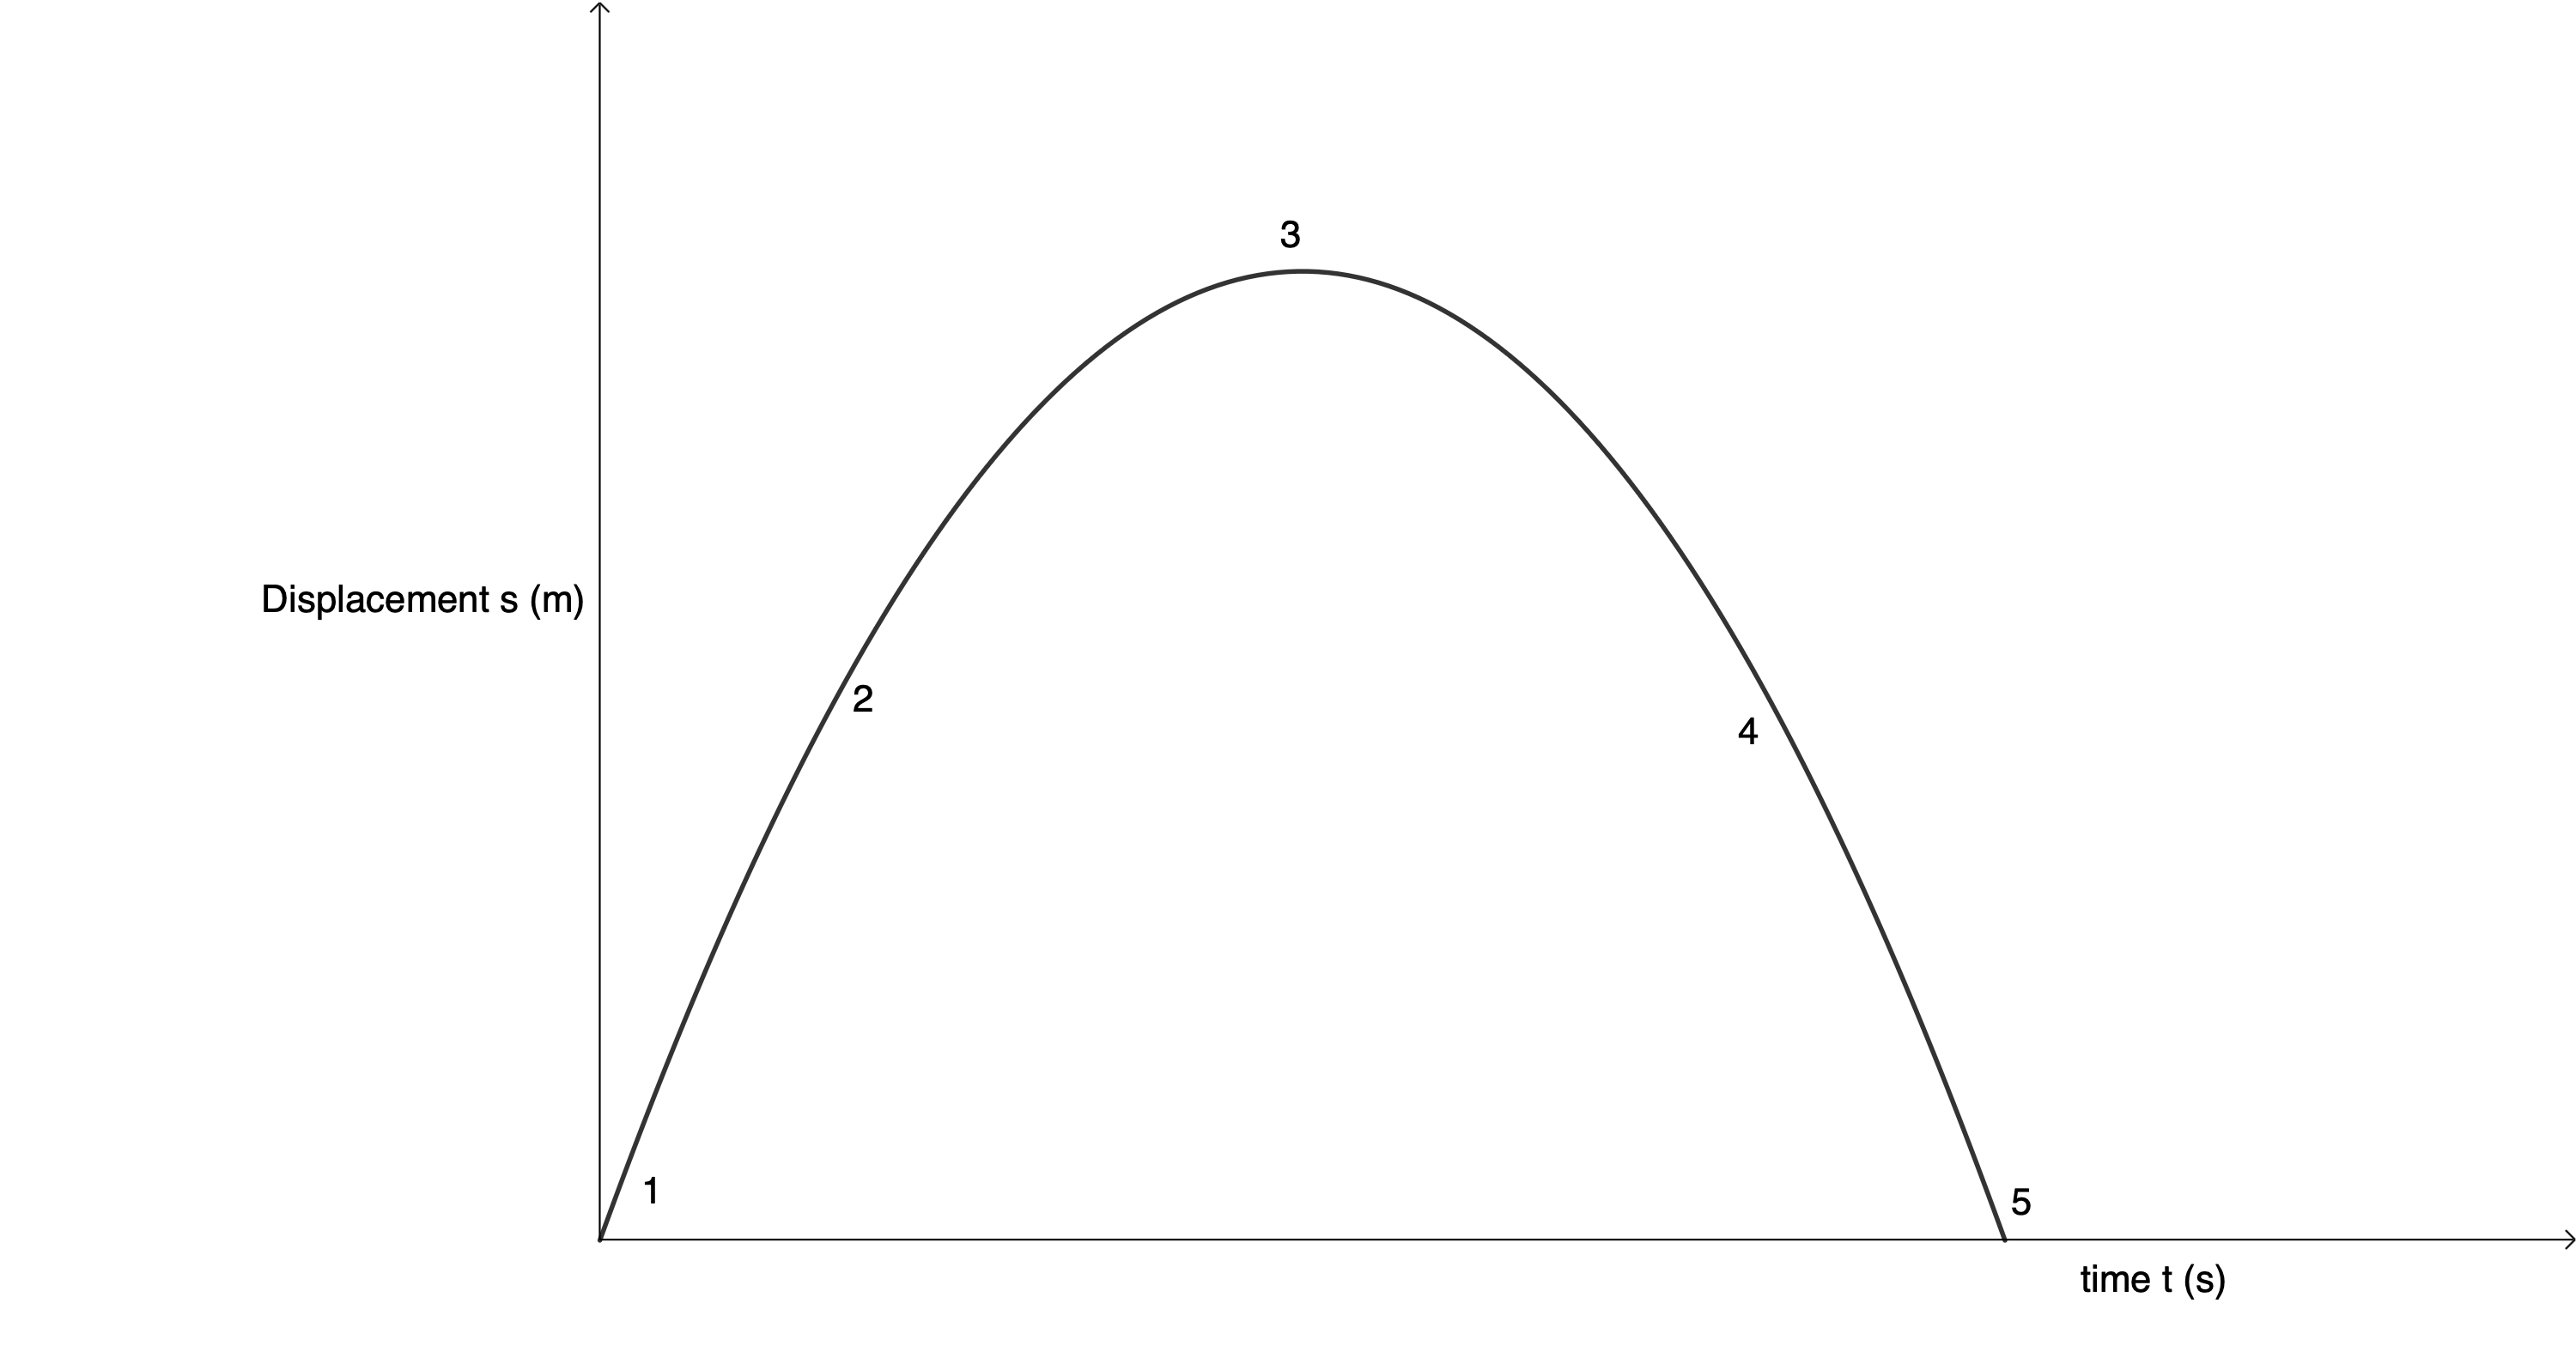
Notice how the slope is not constant. The ball is experiencing a constant negative acceleration due to gravity. On the way up, the ball is decelerating (the slope is decreasing). At its maximum height, the velocity of the ball is zero (the slope is zero). After this, the ball starts to accelerate in the negative direction and so the slope of the line is negative and increasing.
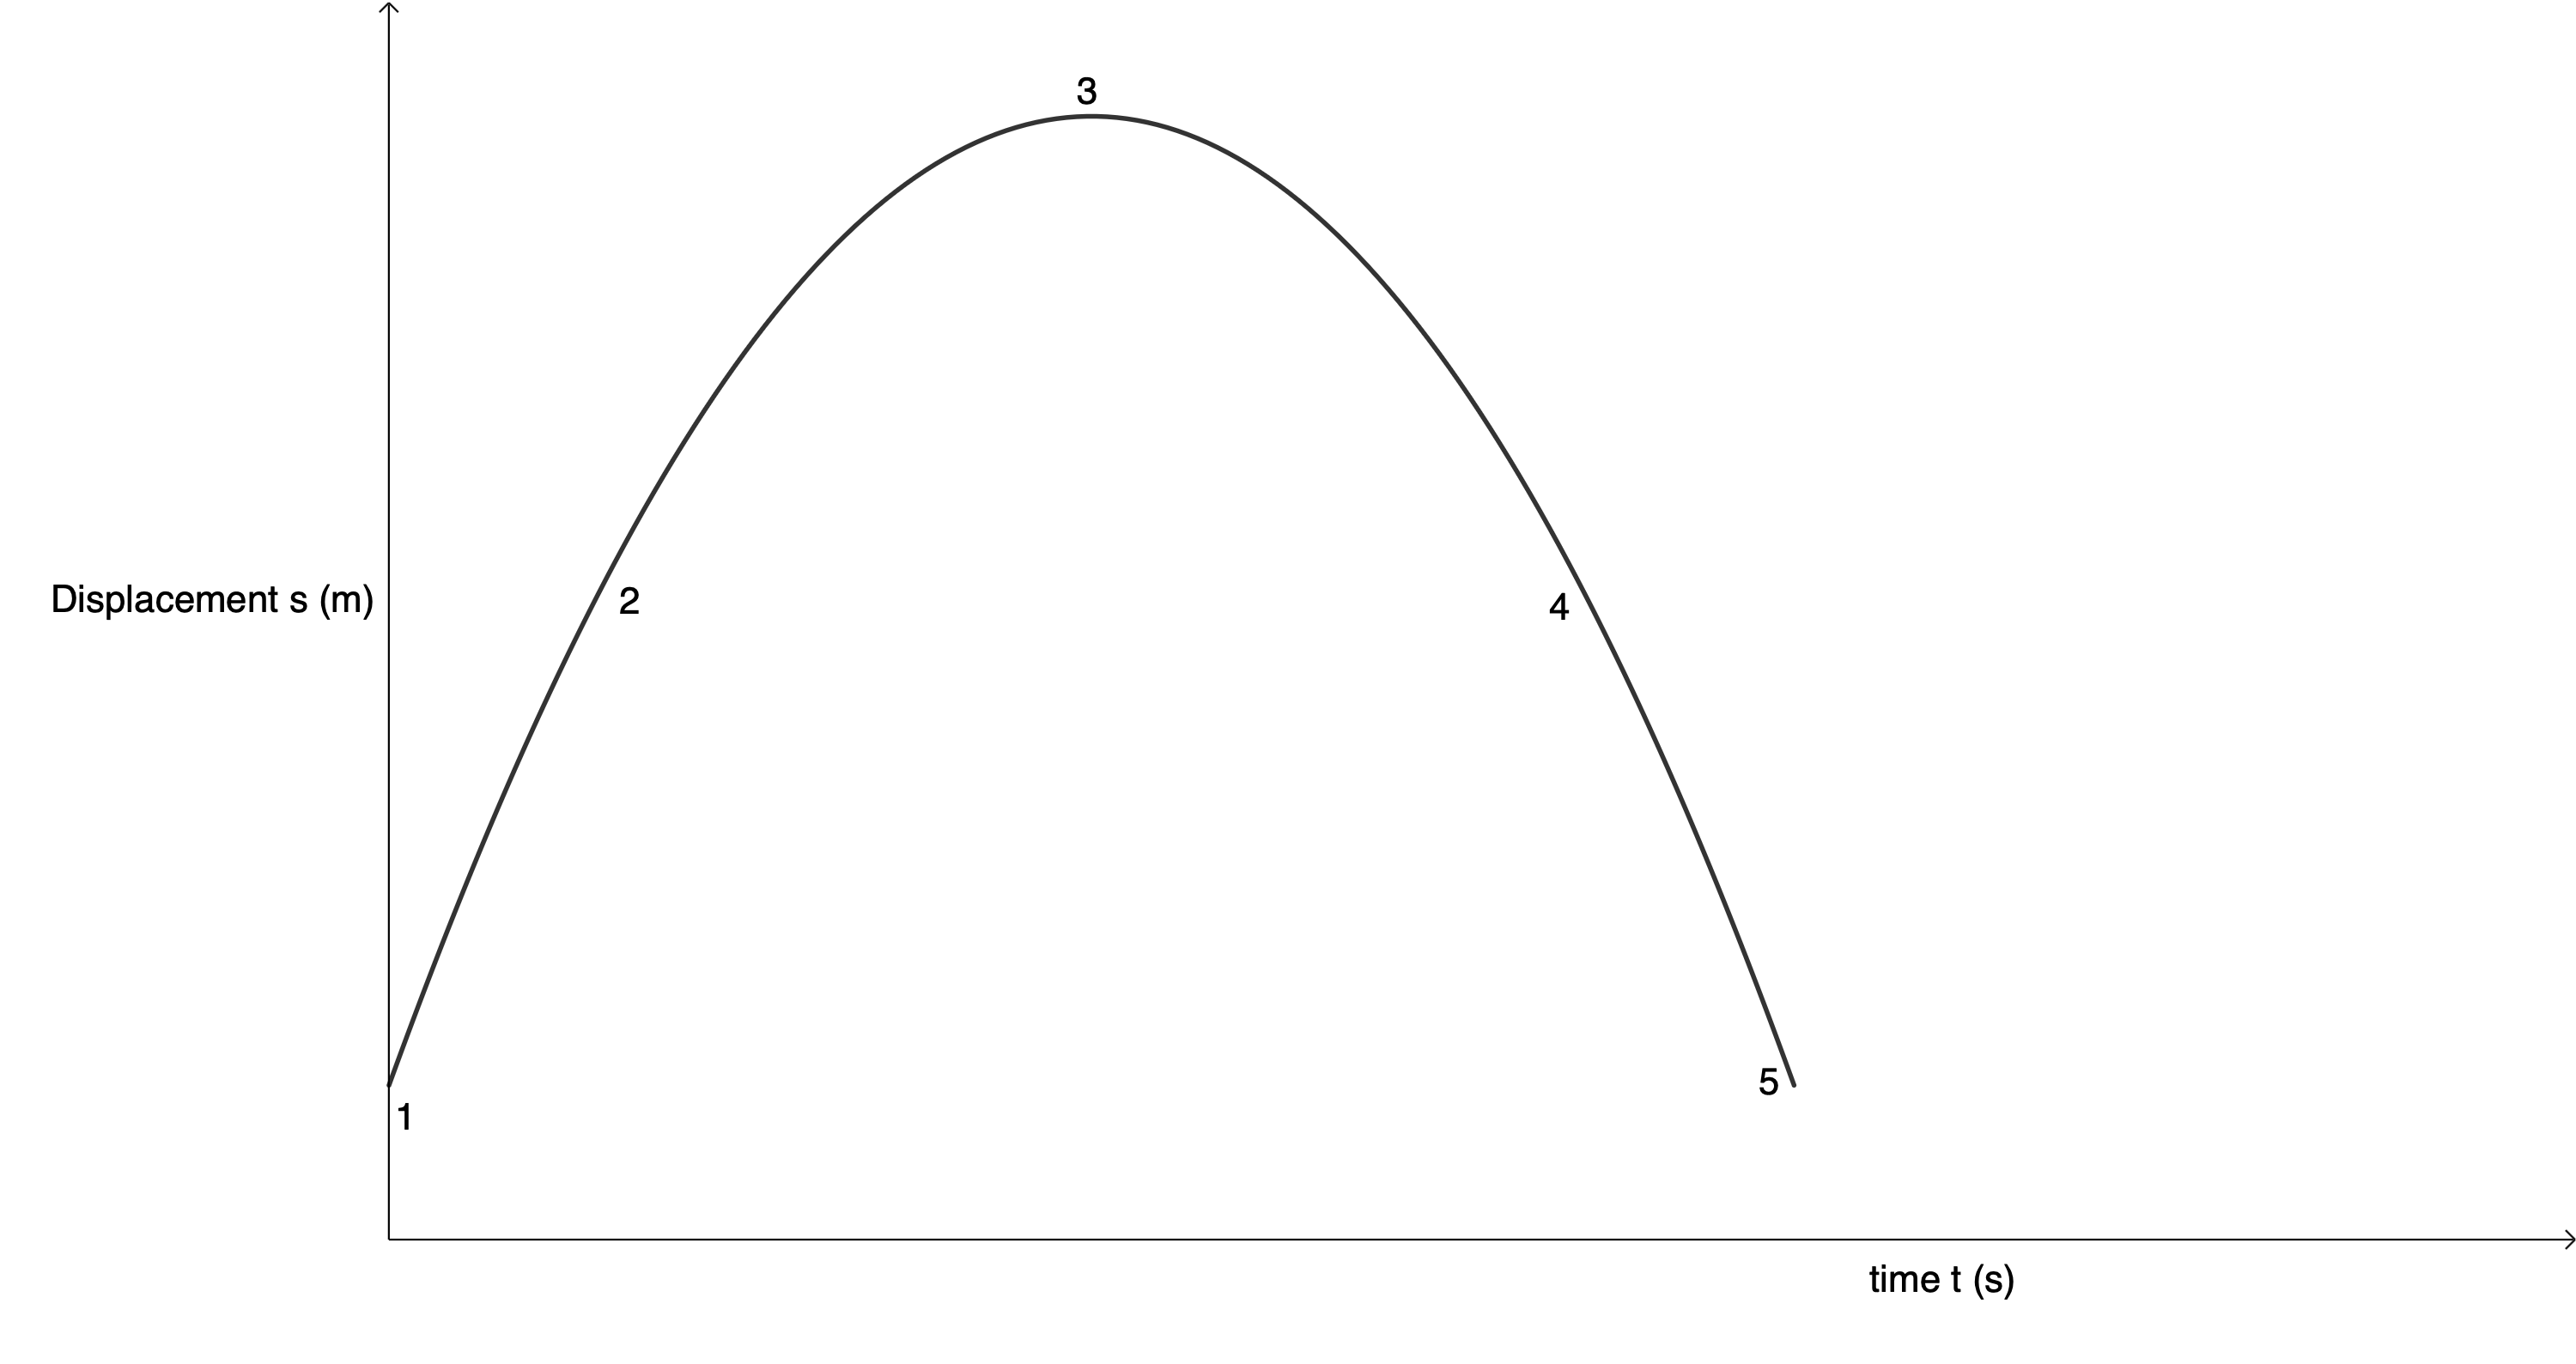
Note that in the graph in figure 2, the displacement is relative to your hand. If your hand were some distance above the ground and we plotted the same motion relative to the ball’s displacement from the ground, the displacement-time graph would look like figure 3.
Now, consider the same situation (a ball thrown vertically up and caught again) but this time draw the velocity-time graph of this motion. Again, make your own sketch before reading on. Again, assume that upwards is positive.
- Initially (at [latex]\scriptsize t = 0~\text{s}[/latex]), the ball will be travelling with some initial positive velocity.
- The ball decelerates while travelling up because it is experiencing a constant negative acceleration due to gravity.
- Eventually, the ball will reach its maximum height at which its velocity will be [latex]\scriptsize 0~\text{m.s}^{-1}[/latex].
- The ball will then start to accelerate in the negative direction as it falls because it continues to experience the same constant negative acceleration due to gravity.
- Finally, the ball will land back in your hand with the same magnitude of velocity with which it was thrown (time symmetry).
If we were to draw this motion, it would look like the velocity-time graph in figure 4.
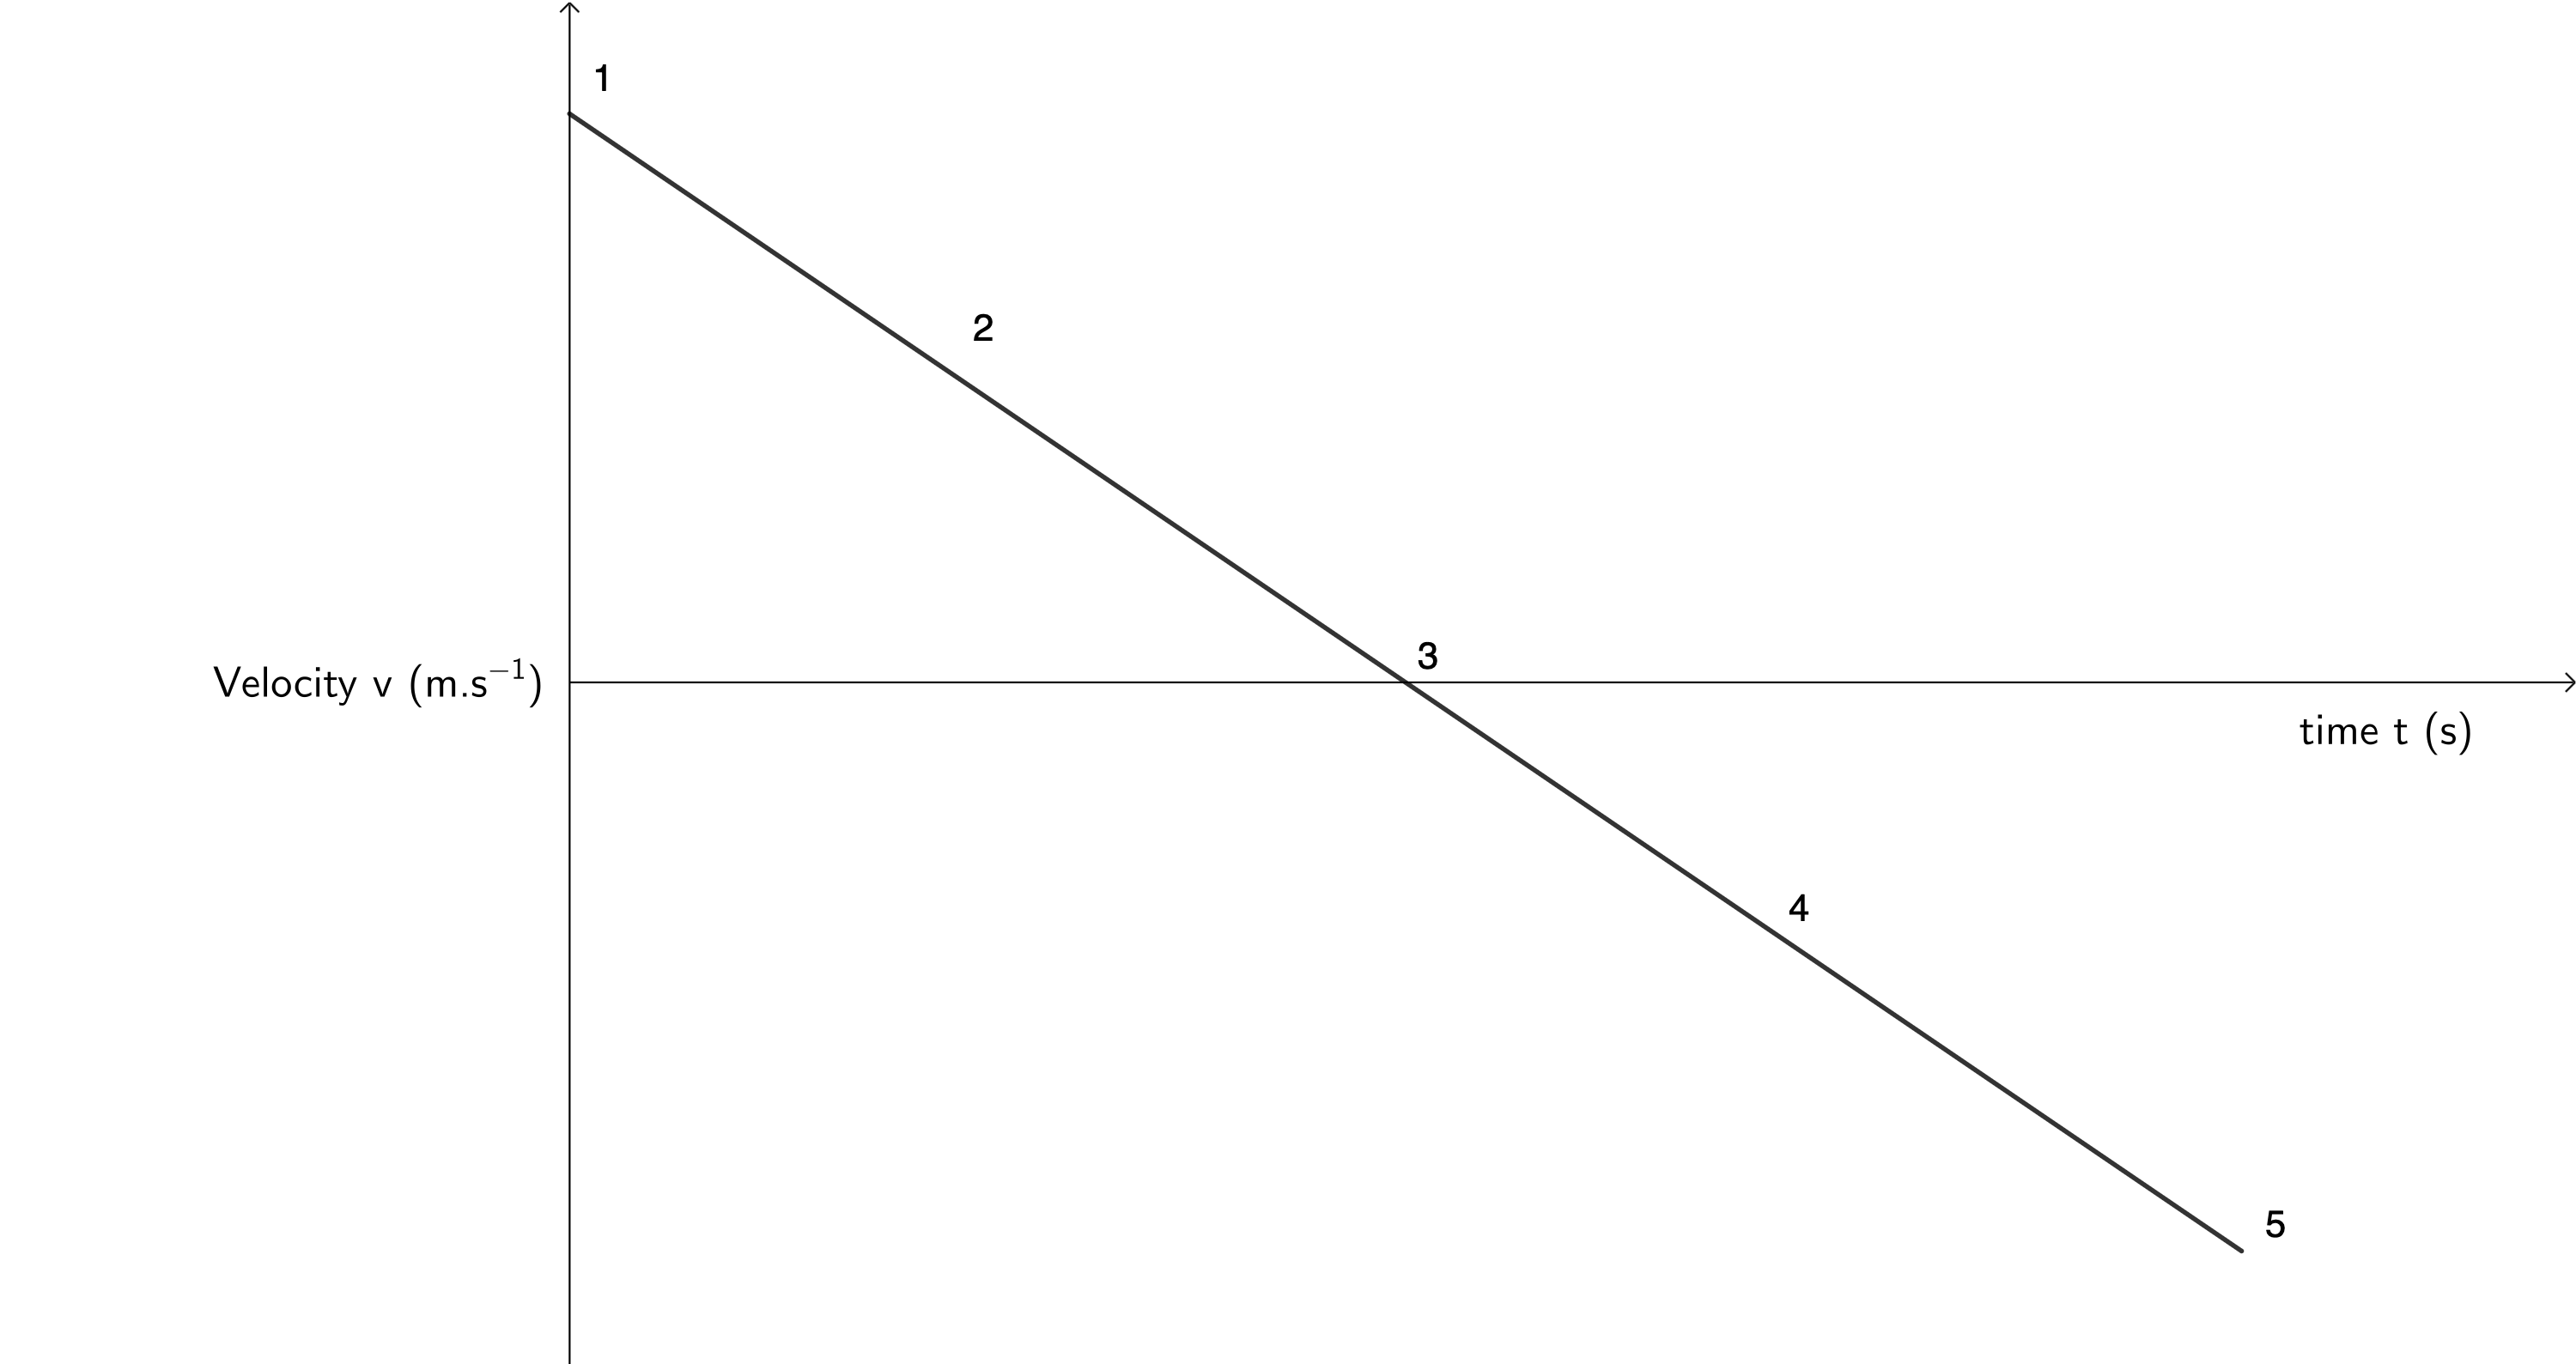
Remember that the final velocity is the same but opposite to the initial velocity and that the time it takes for the ball to travel from your hand to its maximum height is the same as the time it takes for the ball to fall from its maximum height back to your hand.
The slope of the line is constant because the ball experiences a constant acceleration due to gravity. The slop of the line is negative because we defined upwards as positive and acceleration due to gravity is always downwards. If we measured the slope of the velocity-time graph, it would be [latex]\scriptsize -9.8~\text{m.s}^{-2}[/latex].
Finally, draw the acceleration-time graph of this situation. This is the simplest graph to draw if you remember that the ball experiences a constant acceleration due to gravity. Again, assume that upwards it positive.
If we were to draw this motion, it would look like the acceleration-time graph in figure 5.
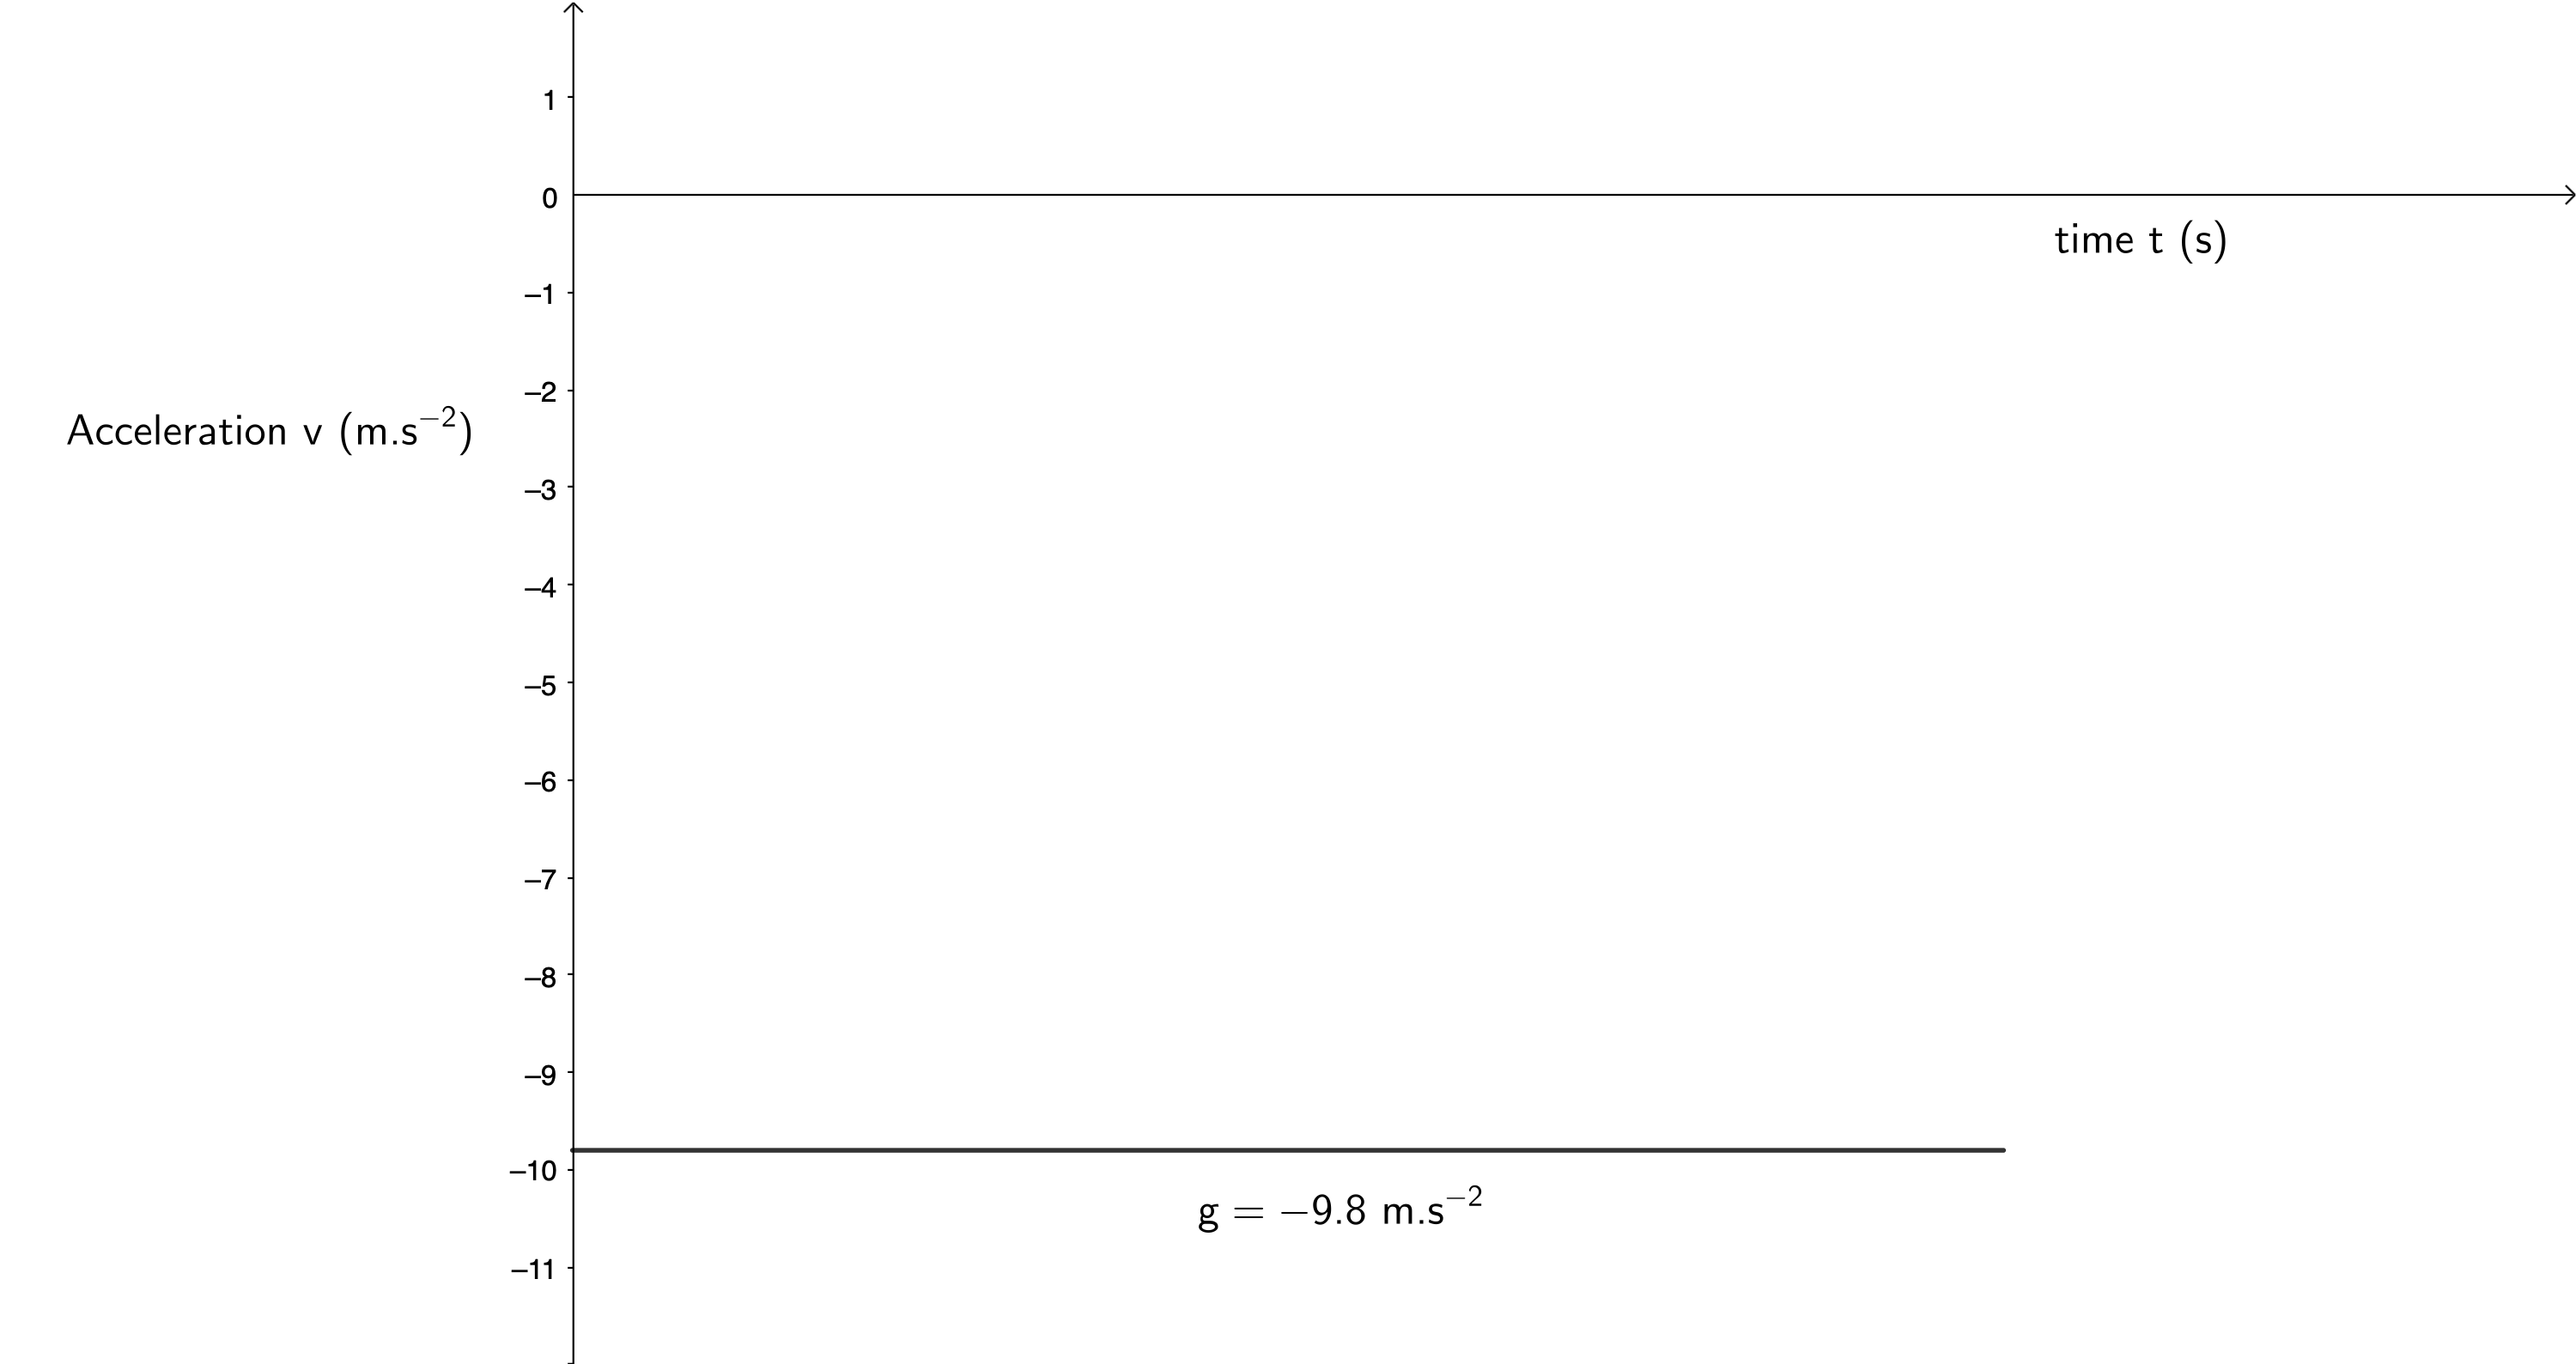
The defining feature of vertical projectile motion is that the object is always subject to a constant acceleration due to gravity of [latex]\scriptsize g = 9.8~{m.s}^{-2}[/latex]. Because we defined upwards as positive and because acceleration due to gravity always acts downwards, we represent this constant gravity as [latex]\scriptsize -9.8~\text{m.s}^{-2}[/latex] in our acceleration-time graph.
Drawing graphs of vertical projectile motion
Whenever you are asked to draw a graph representing vertical projectile motion, remember that:
- the object experiences a constant acceleration due to gravity of [latex]\scriptsize 9.8~\text{m.s}^{-2}[/latex]; and
- this constant acceleration is always downwards.
Example 2.1
A learner stands on a first-floor balcony and throws a cricket ball vertically up into the air with an initial velocity of [latex]\scriptsize 4~\text{m.s}^{-1}[/latex]. It reaches its maximum height and then falls to the ground. If the ball is thrown from a height of [latex]\scriptsize 10~\text{m}[/latex], draw an accurate:
- displacement-time graph
- velocity-time graph
- acceleration-time graph.
Solutions
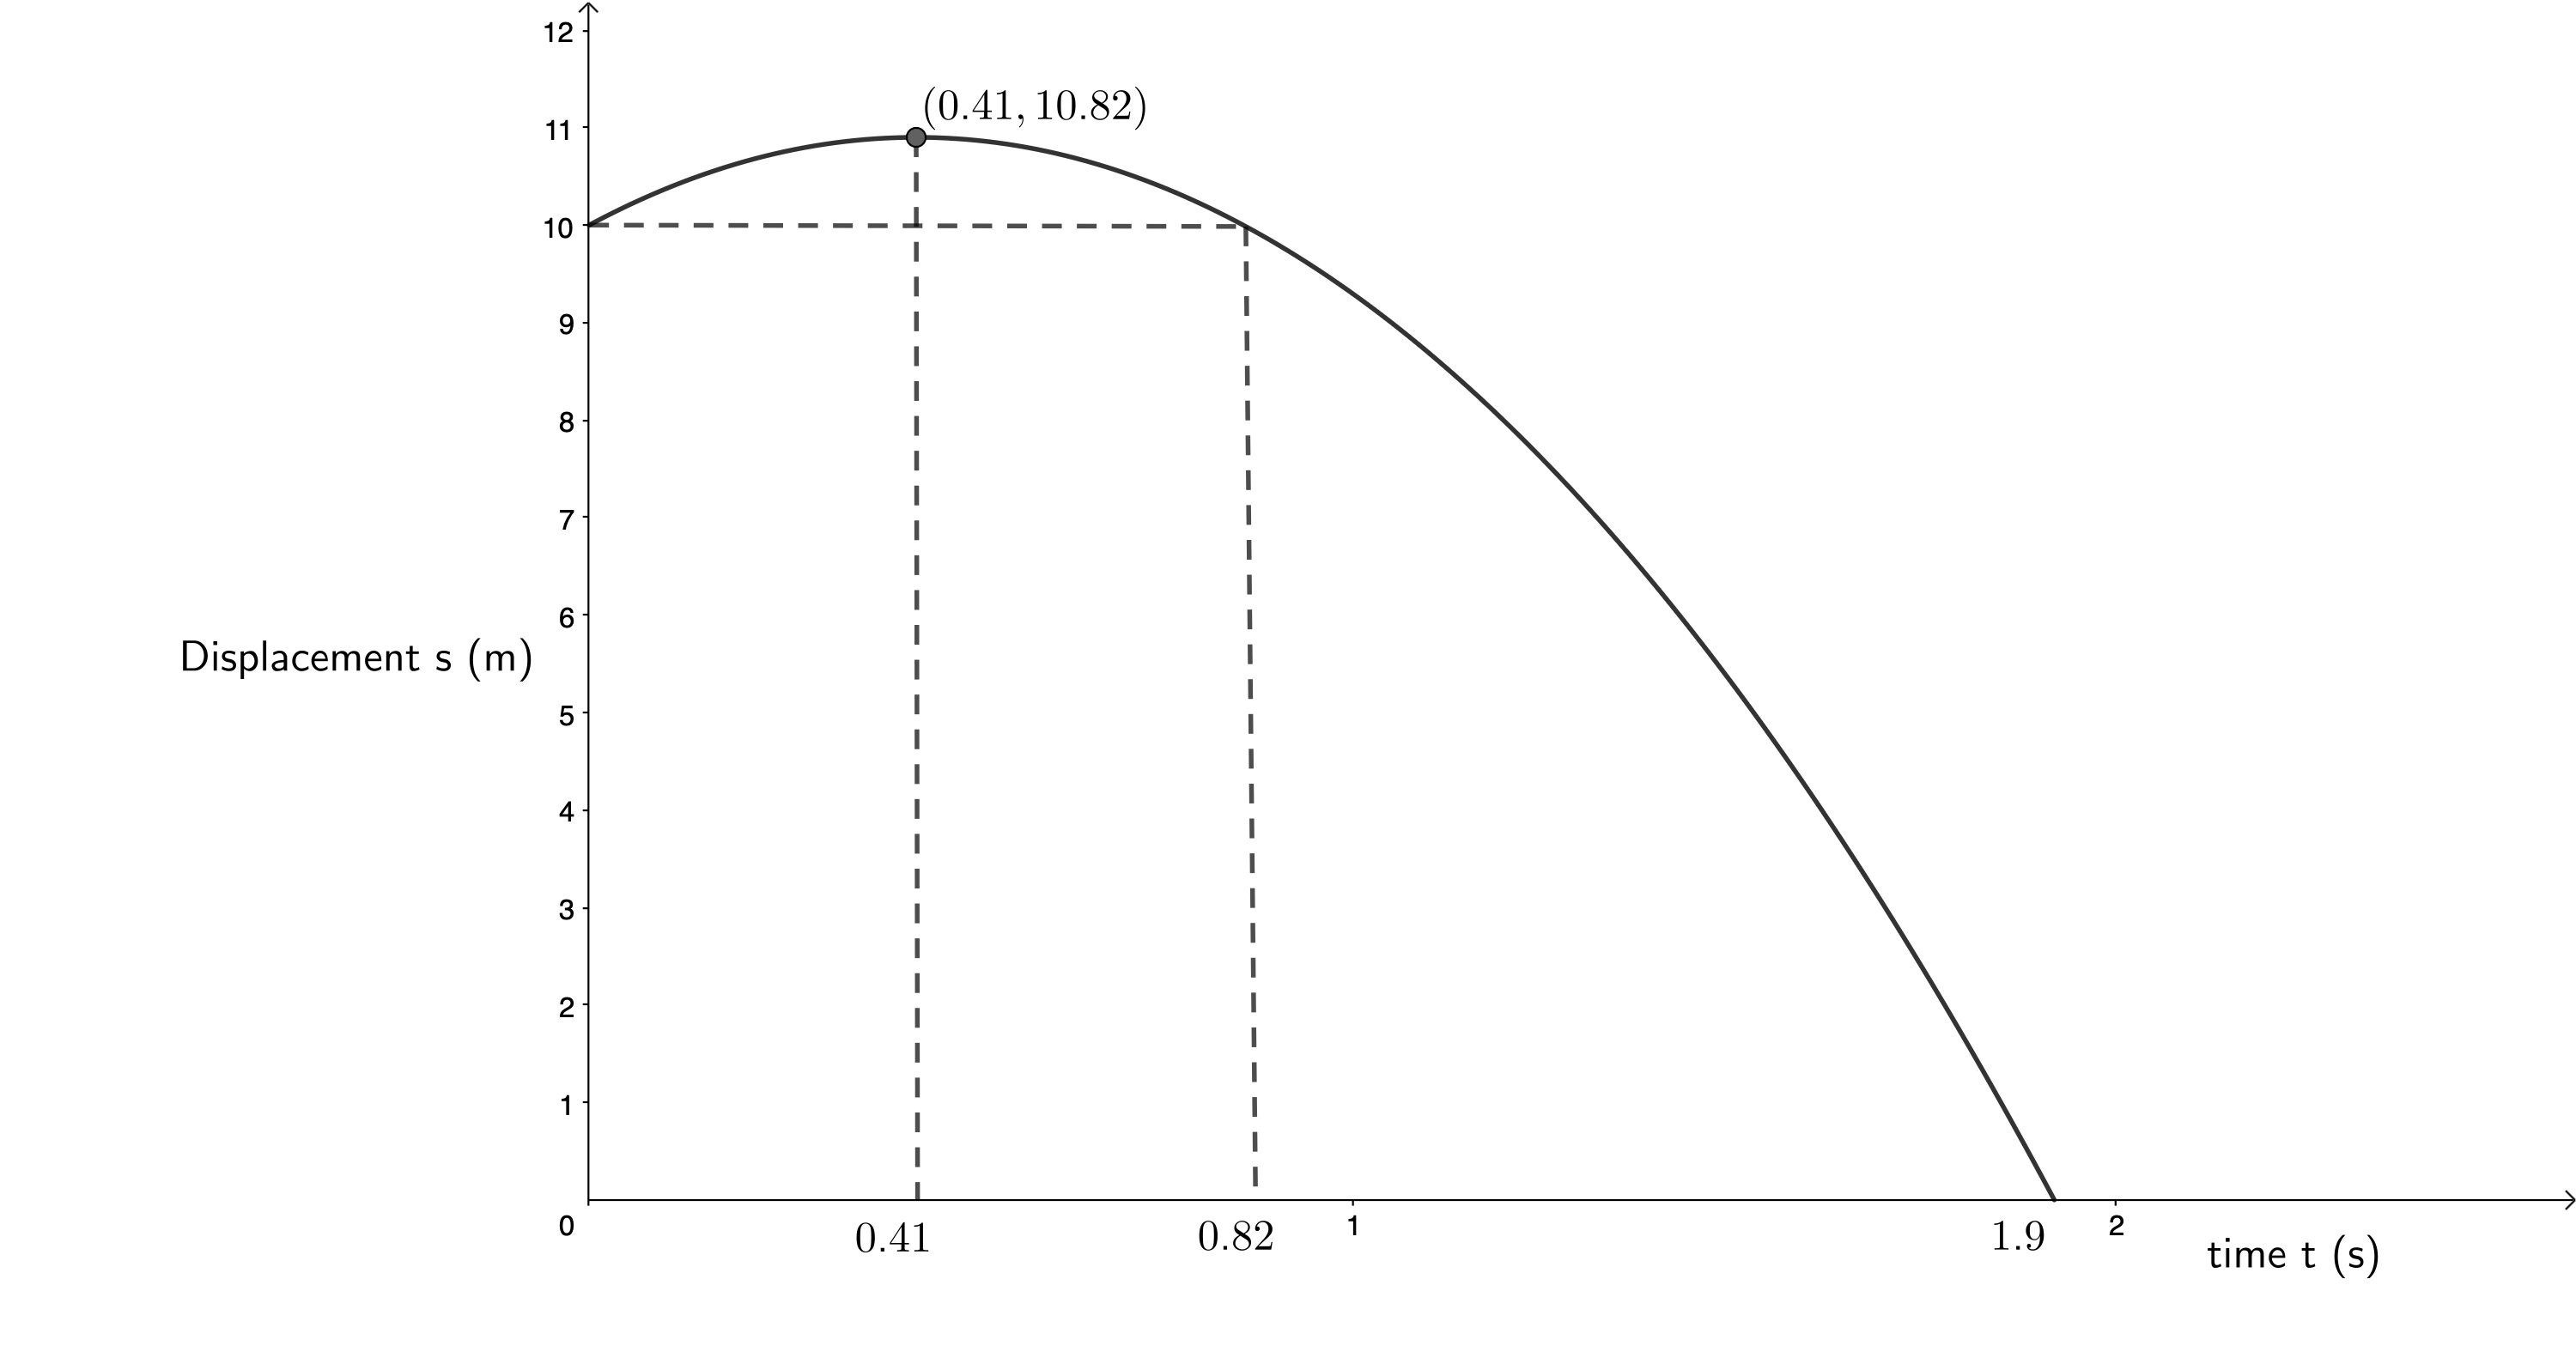
- We know that the ball’s initial displacement from the ground is [latex]\scriptsize 10~\text{m}[/latex]. We will draw the displacement-time graph relative to the ground and assign upwards as positive.
.
We need to calculate the following to draw the displacement-time graph:- the time it takes for the ball to reach its maximum height
- the ball’s maximum height above the ground
- the time it takes the ball to fall to the ground.
The time it takes for the ball to reach its maximum height:
[latex]\scriptsize \begin {align*} v_i &= 4~\text{m.s}^{-1}\\ v_f&=-14~\text{m.s}^{-1}\\ a &= -9.8 \text{m.s}^{-2}\\ v_f&=v_i+at\\ \therefore t&=\displaystyle \frac{v_f-v_i}{a}\\ &=0.41~\text{s} \end{align*}[/latex]
The ball’s maximum height above the ground.
[latex]\scriptsize \begin {align*} v_i&=4~\text{m.s}^{-1}\\ a&= -9.8~\text{m.s}^{-2}\\ t&=0.41~\text{s}\\ s&=v_it+\displaystyle \frac{1}{2}at^2\\ &=0.82~\text{m} \end{align*}[/latex]
This is the height of the ball above the hand that threw it. Therefore, the ball’s height above the ground is [latex]\scriptsize 0.82~\text{m} + 10~\text{m} = 10.82~\text{m}[/latex].
The time it takes the ball to fall to the ground:
[latex]\scriptsize \begin {align*} v_i&=0~\text{m.s}^{-1}\\ a&=-9.8 \text~\text{m.s}^{-2}\\ s&=-10.82~\text{m}&&\text{Remember that displacement is }\\ &&&x_f-x_i=0~\text{m}-10.82~\text{m}=-10.82~\text{m}\\ s&=v_it+\displaystyle \frac{1}{2}at^2\\ \text{But }v_i&=0~\text{m.s}^{-1}\\ \therefore s&=\displaystyle \frac{1}{2}at^2\\ \therefore t&=\sqrt{\displaystyle \frac{2s}{a}}\\ &=1.49~\text{s} \end{align*}[/latex]
Therefore, the total time the ball is in the air is [latex]\scriptsize 0.41~\text{s} + 1.49~\text{s} = 1.9~\text{s}[/latex].
Now we can draw an accurate displacement-time graph as follows.
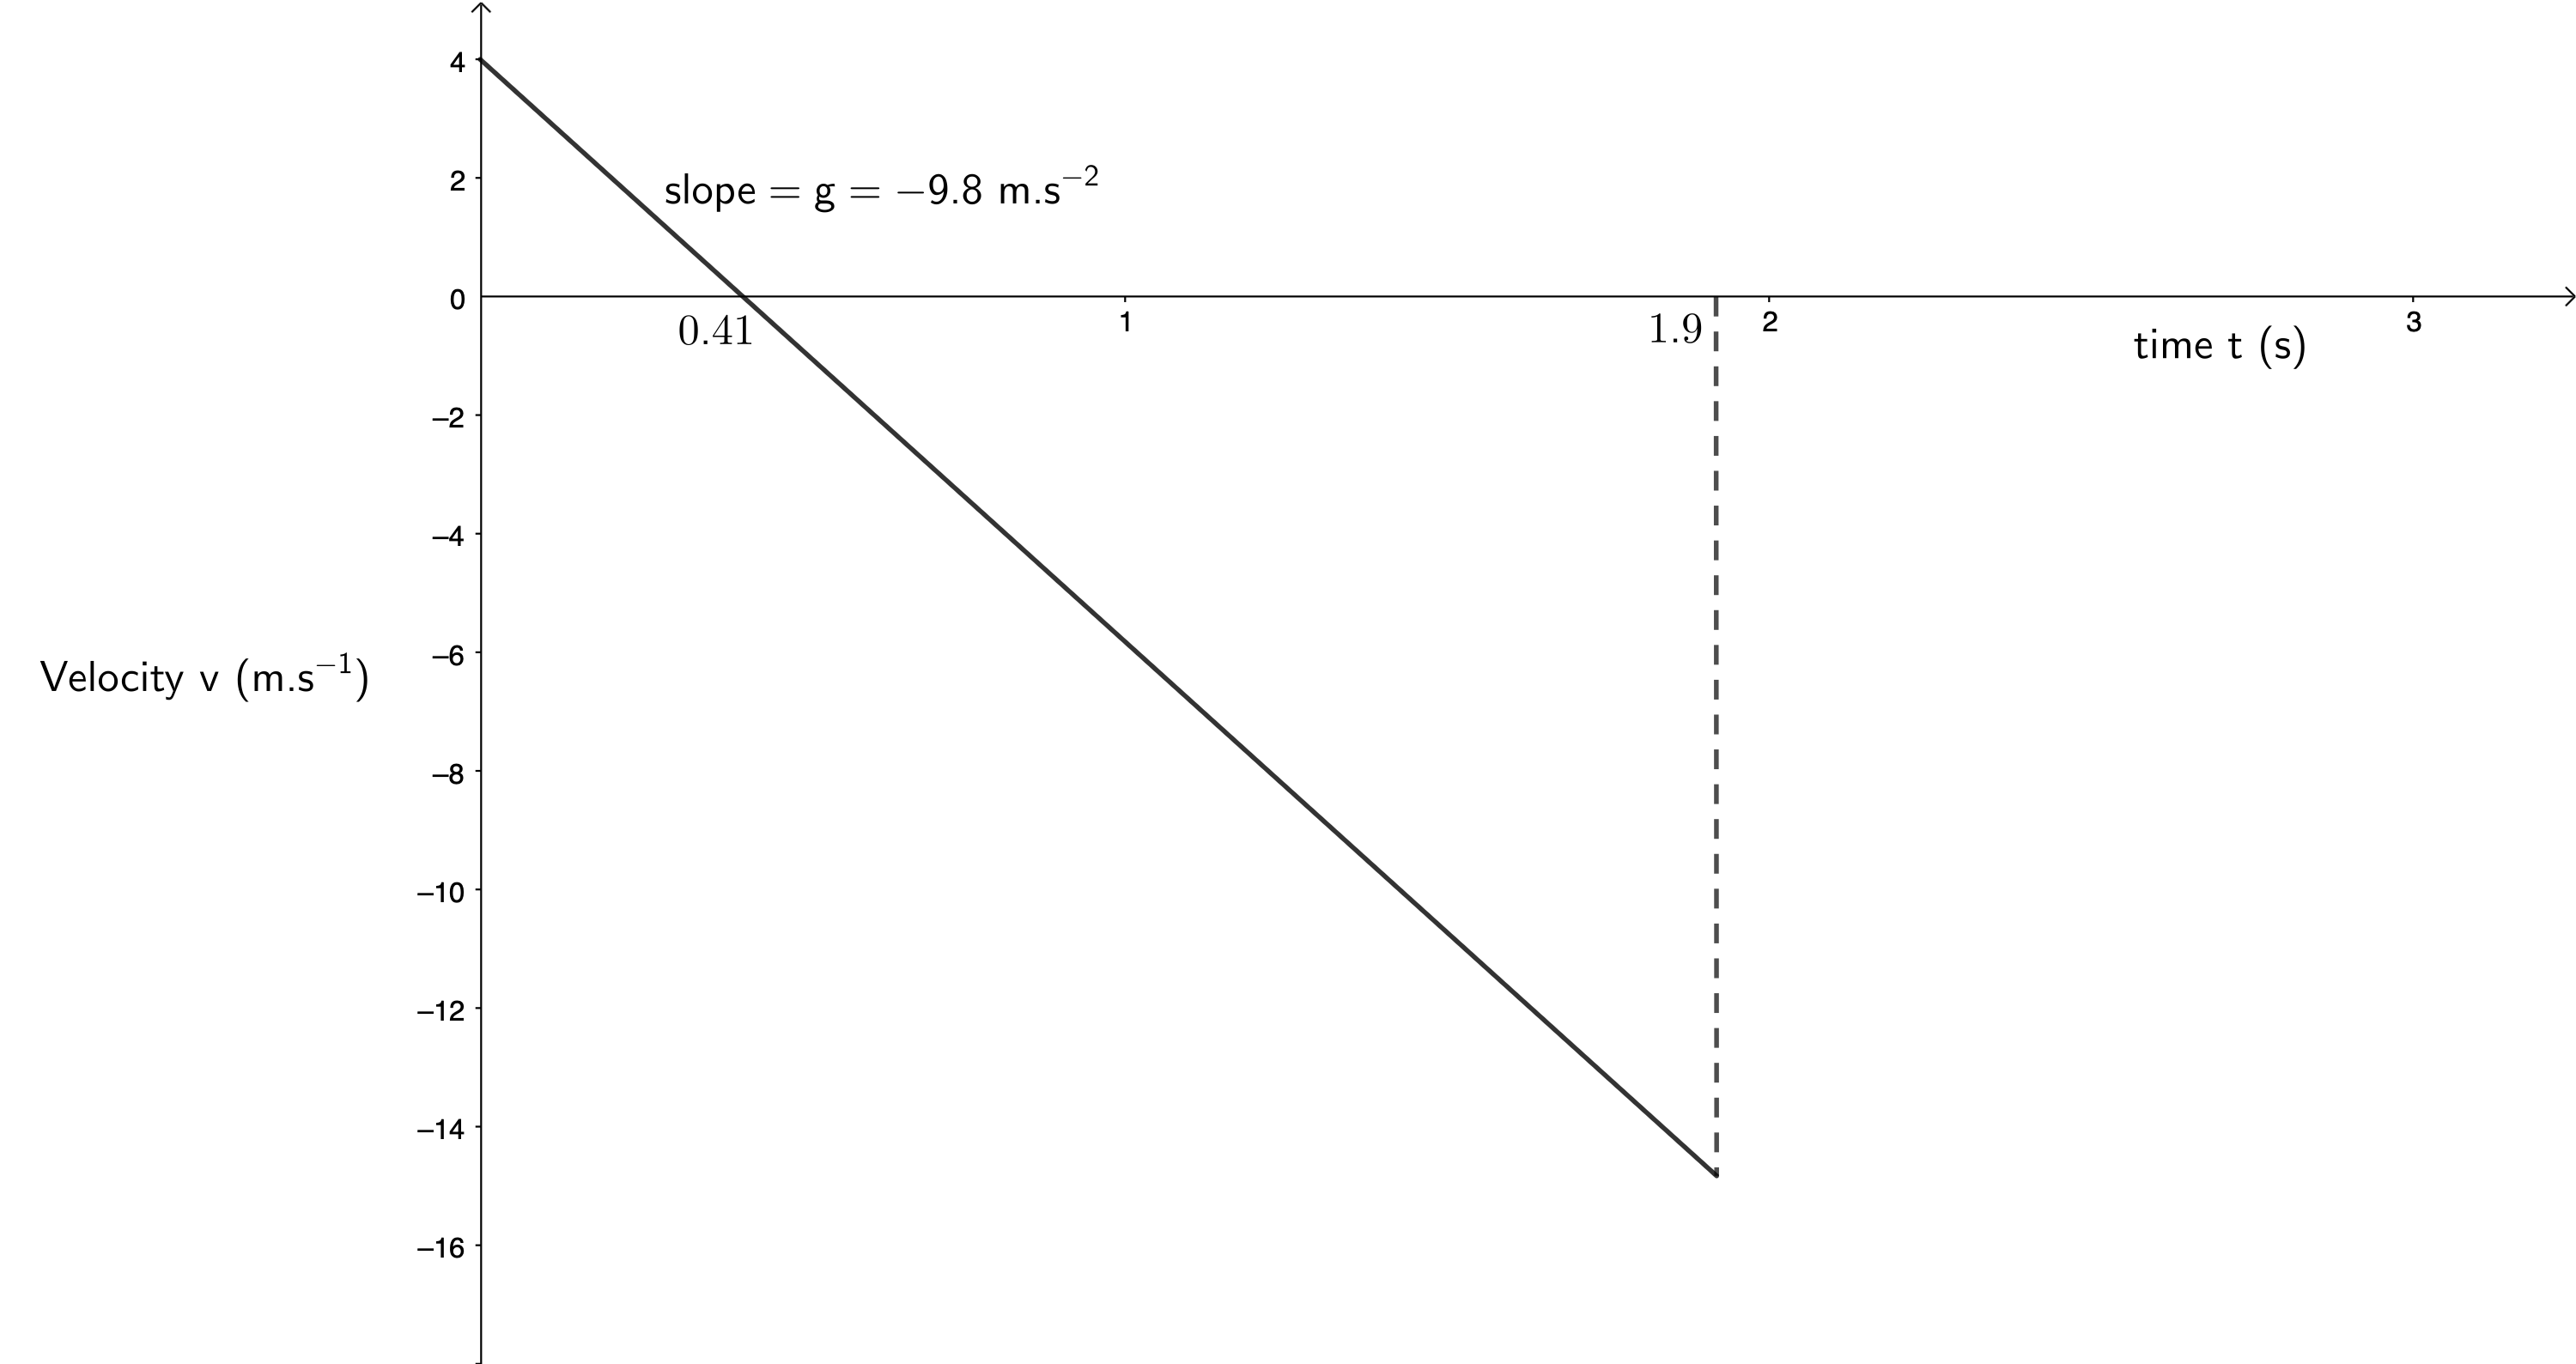
- When we are dealing with vertical projectile motion, we know that there is a constant acceleration due to gravity of [latex]\scriptsize 9.8~\text{m.s}^{-2}[/latex] downwards. Therefore, we know that the slope of any velocity-time graph will be [latex]\scriptsize – 9.8~\text{m.s}^{-2}[/latex]. If we know the initial velocity ([latex]\scriptsize 4~\text{m.s}^{-1}[/latex] in this case) and the length of time the object is in the air ([latex]\scriptsize 1.49~\text{s}[/latex] as calculated above) then we can draw the velocity-time graph. We know that the ball will have a velocity of [latex]\scriptsize 0~\text{m.s}^{-1}[/latex] as it reaches its maximum height after [latex]\scriptsize 0.41~\text{s}[/latex].
Remember that we made upwards positive. This is why the ball’s initial velocity is positive. But after it reaches its maximum height, it starts to fall and has a negative velocity.
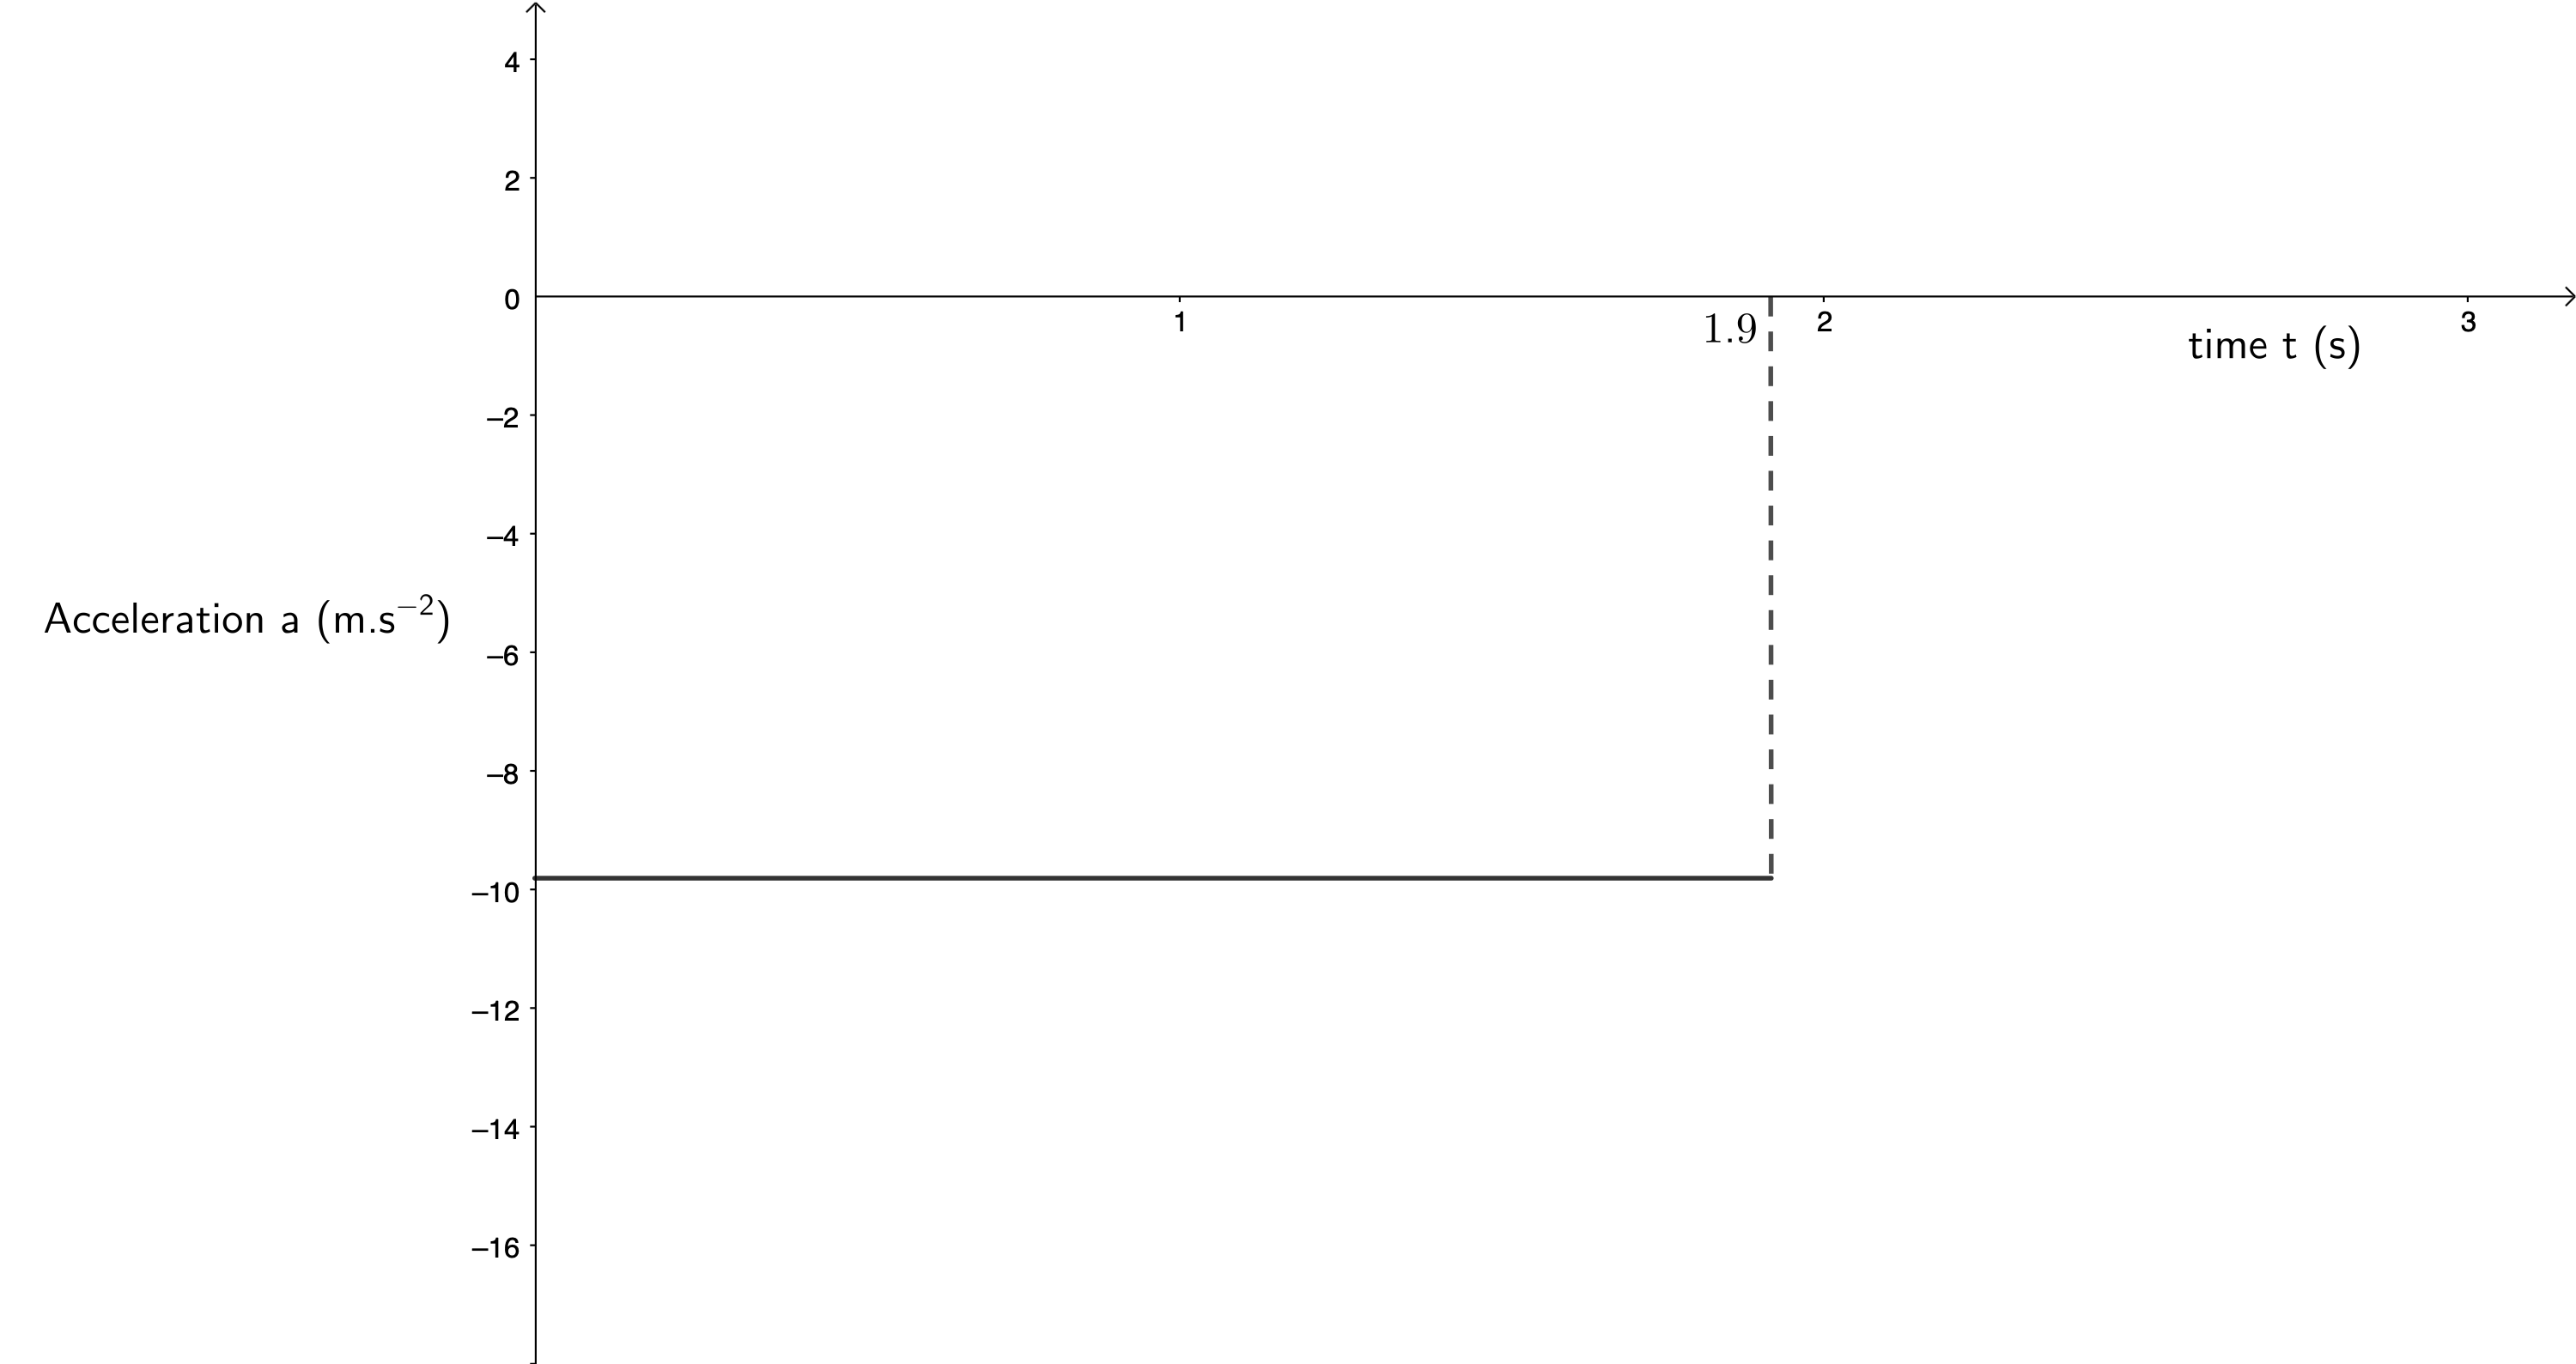
- Drawing acceleration-time graphs of vertical projectile motion is straightforward as long as you remember that there is a constant acceleration due to gravity downwards.
Example 2.2
Question adapted from Everything Science Grade 12 Worked example 6 page 93
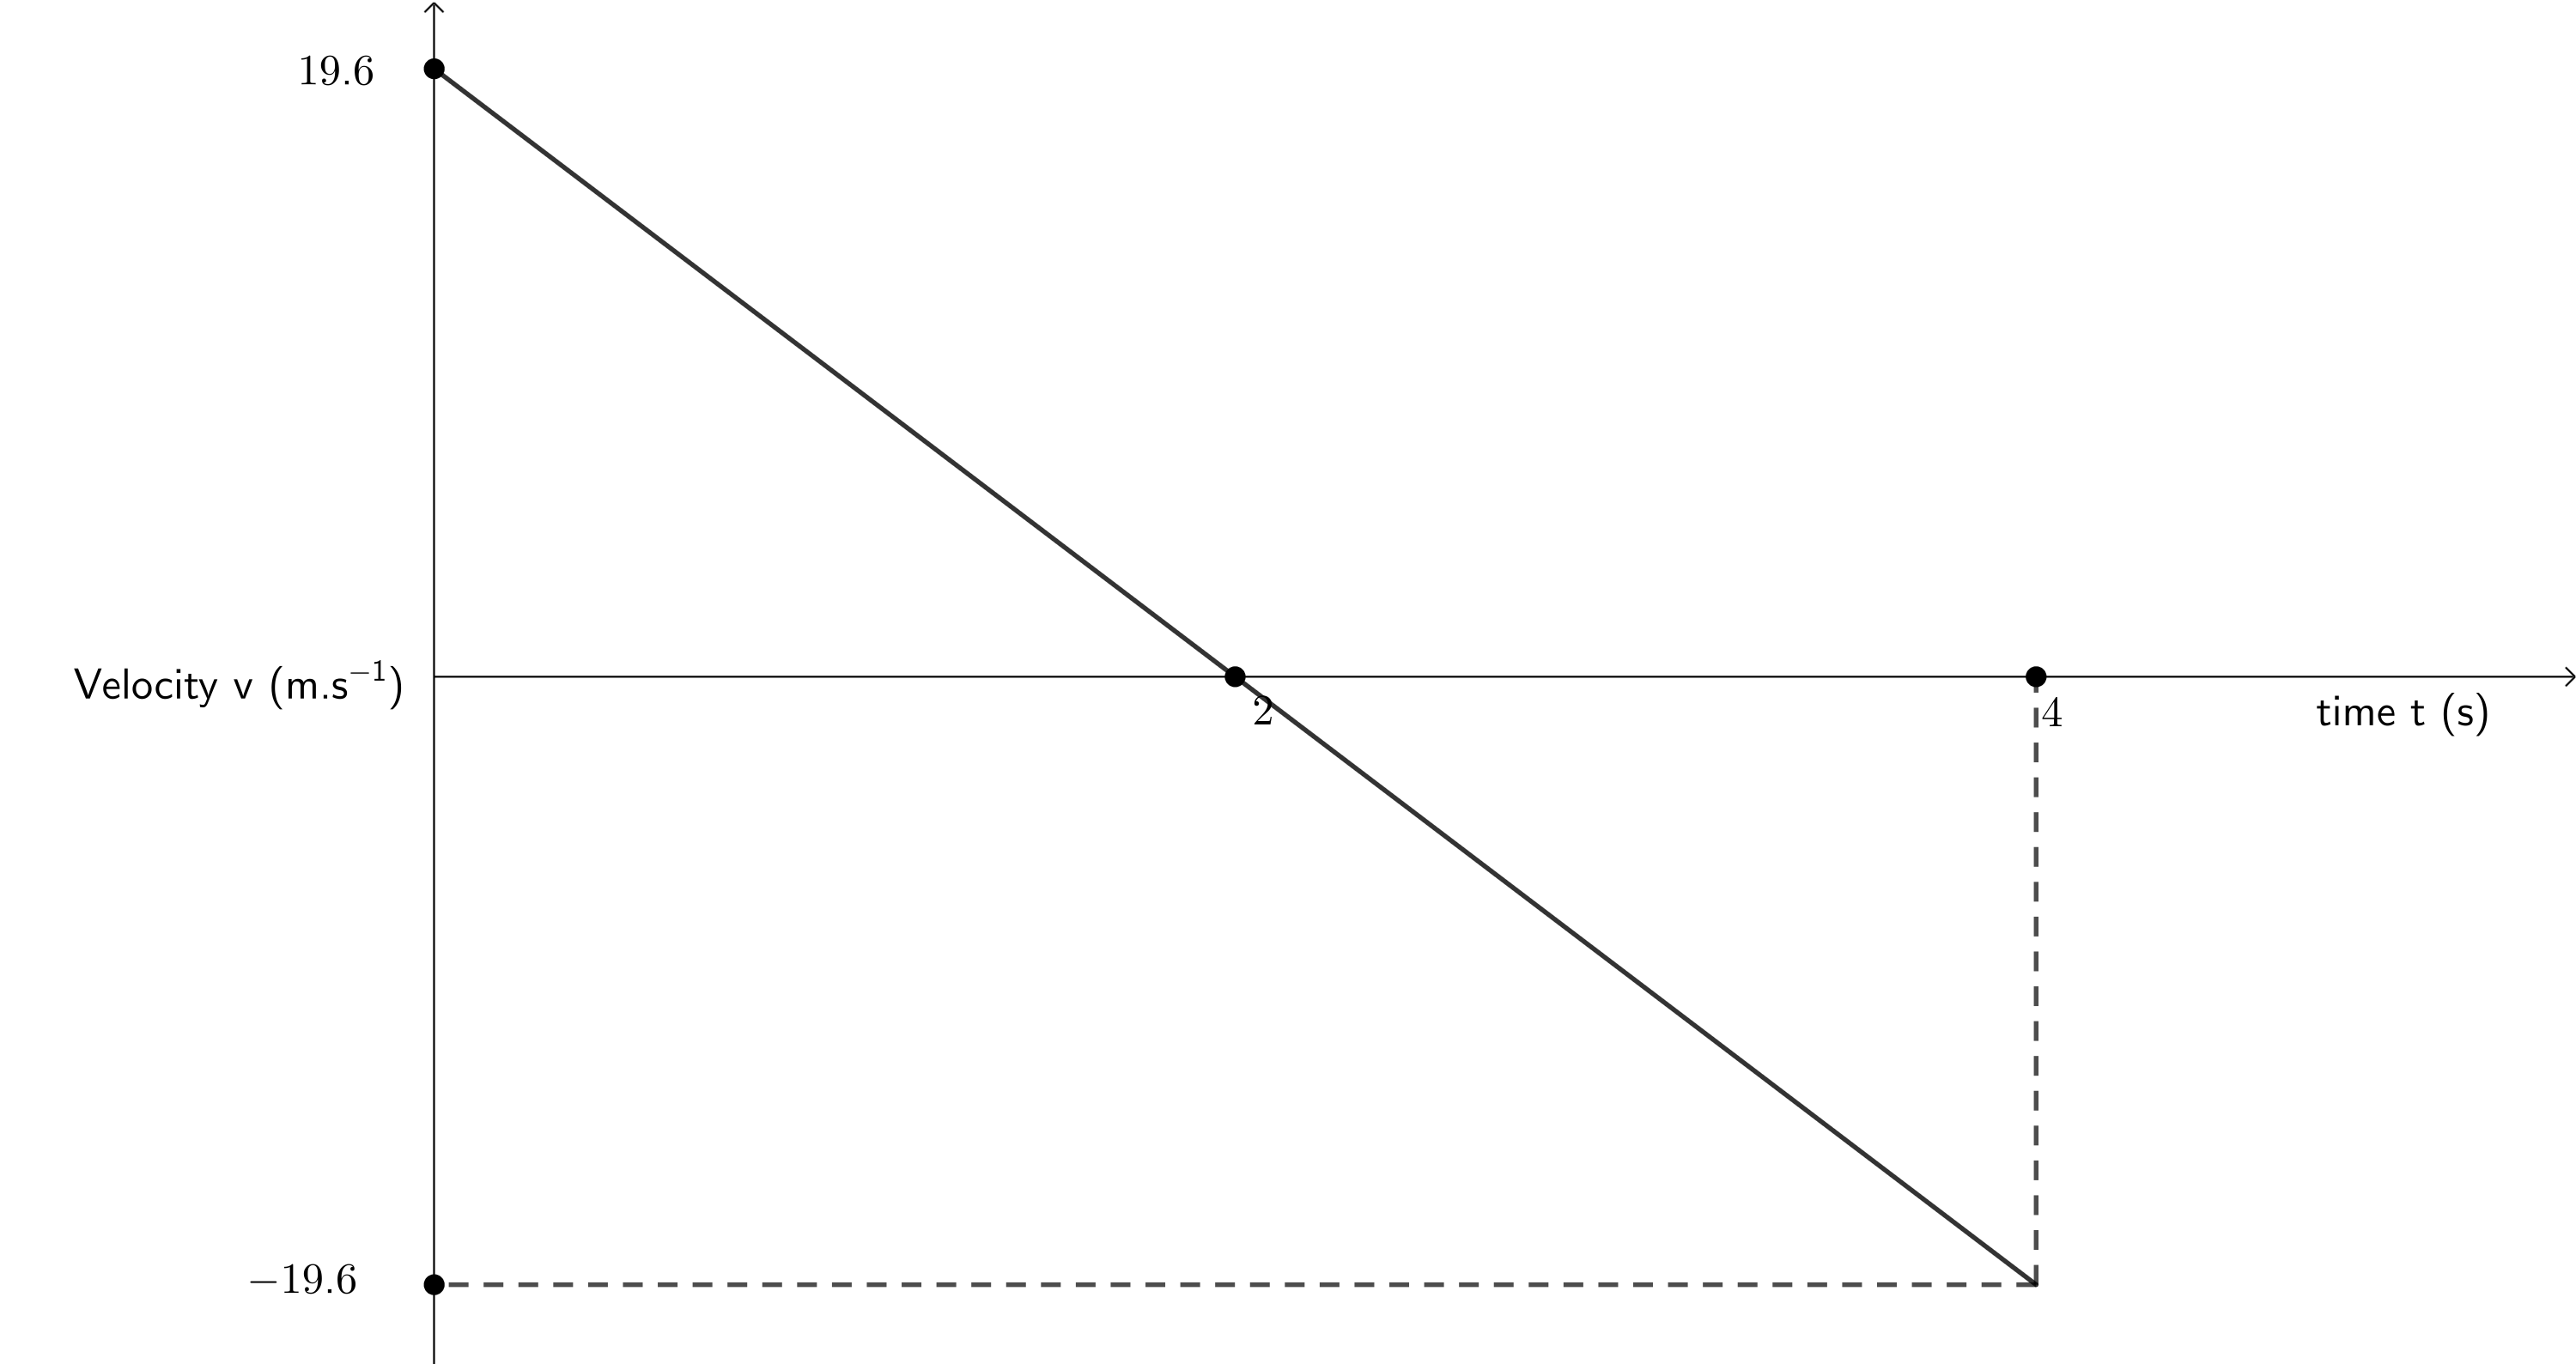
A cricketer hits a cricket ball from the ground and the following graph of velocity vs time was drawn. Upwards was taken as positive. Study the graph and follow the instructions below:
- Describe the motion of the ball according to the graph.
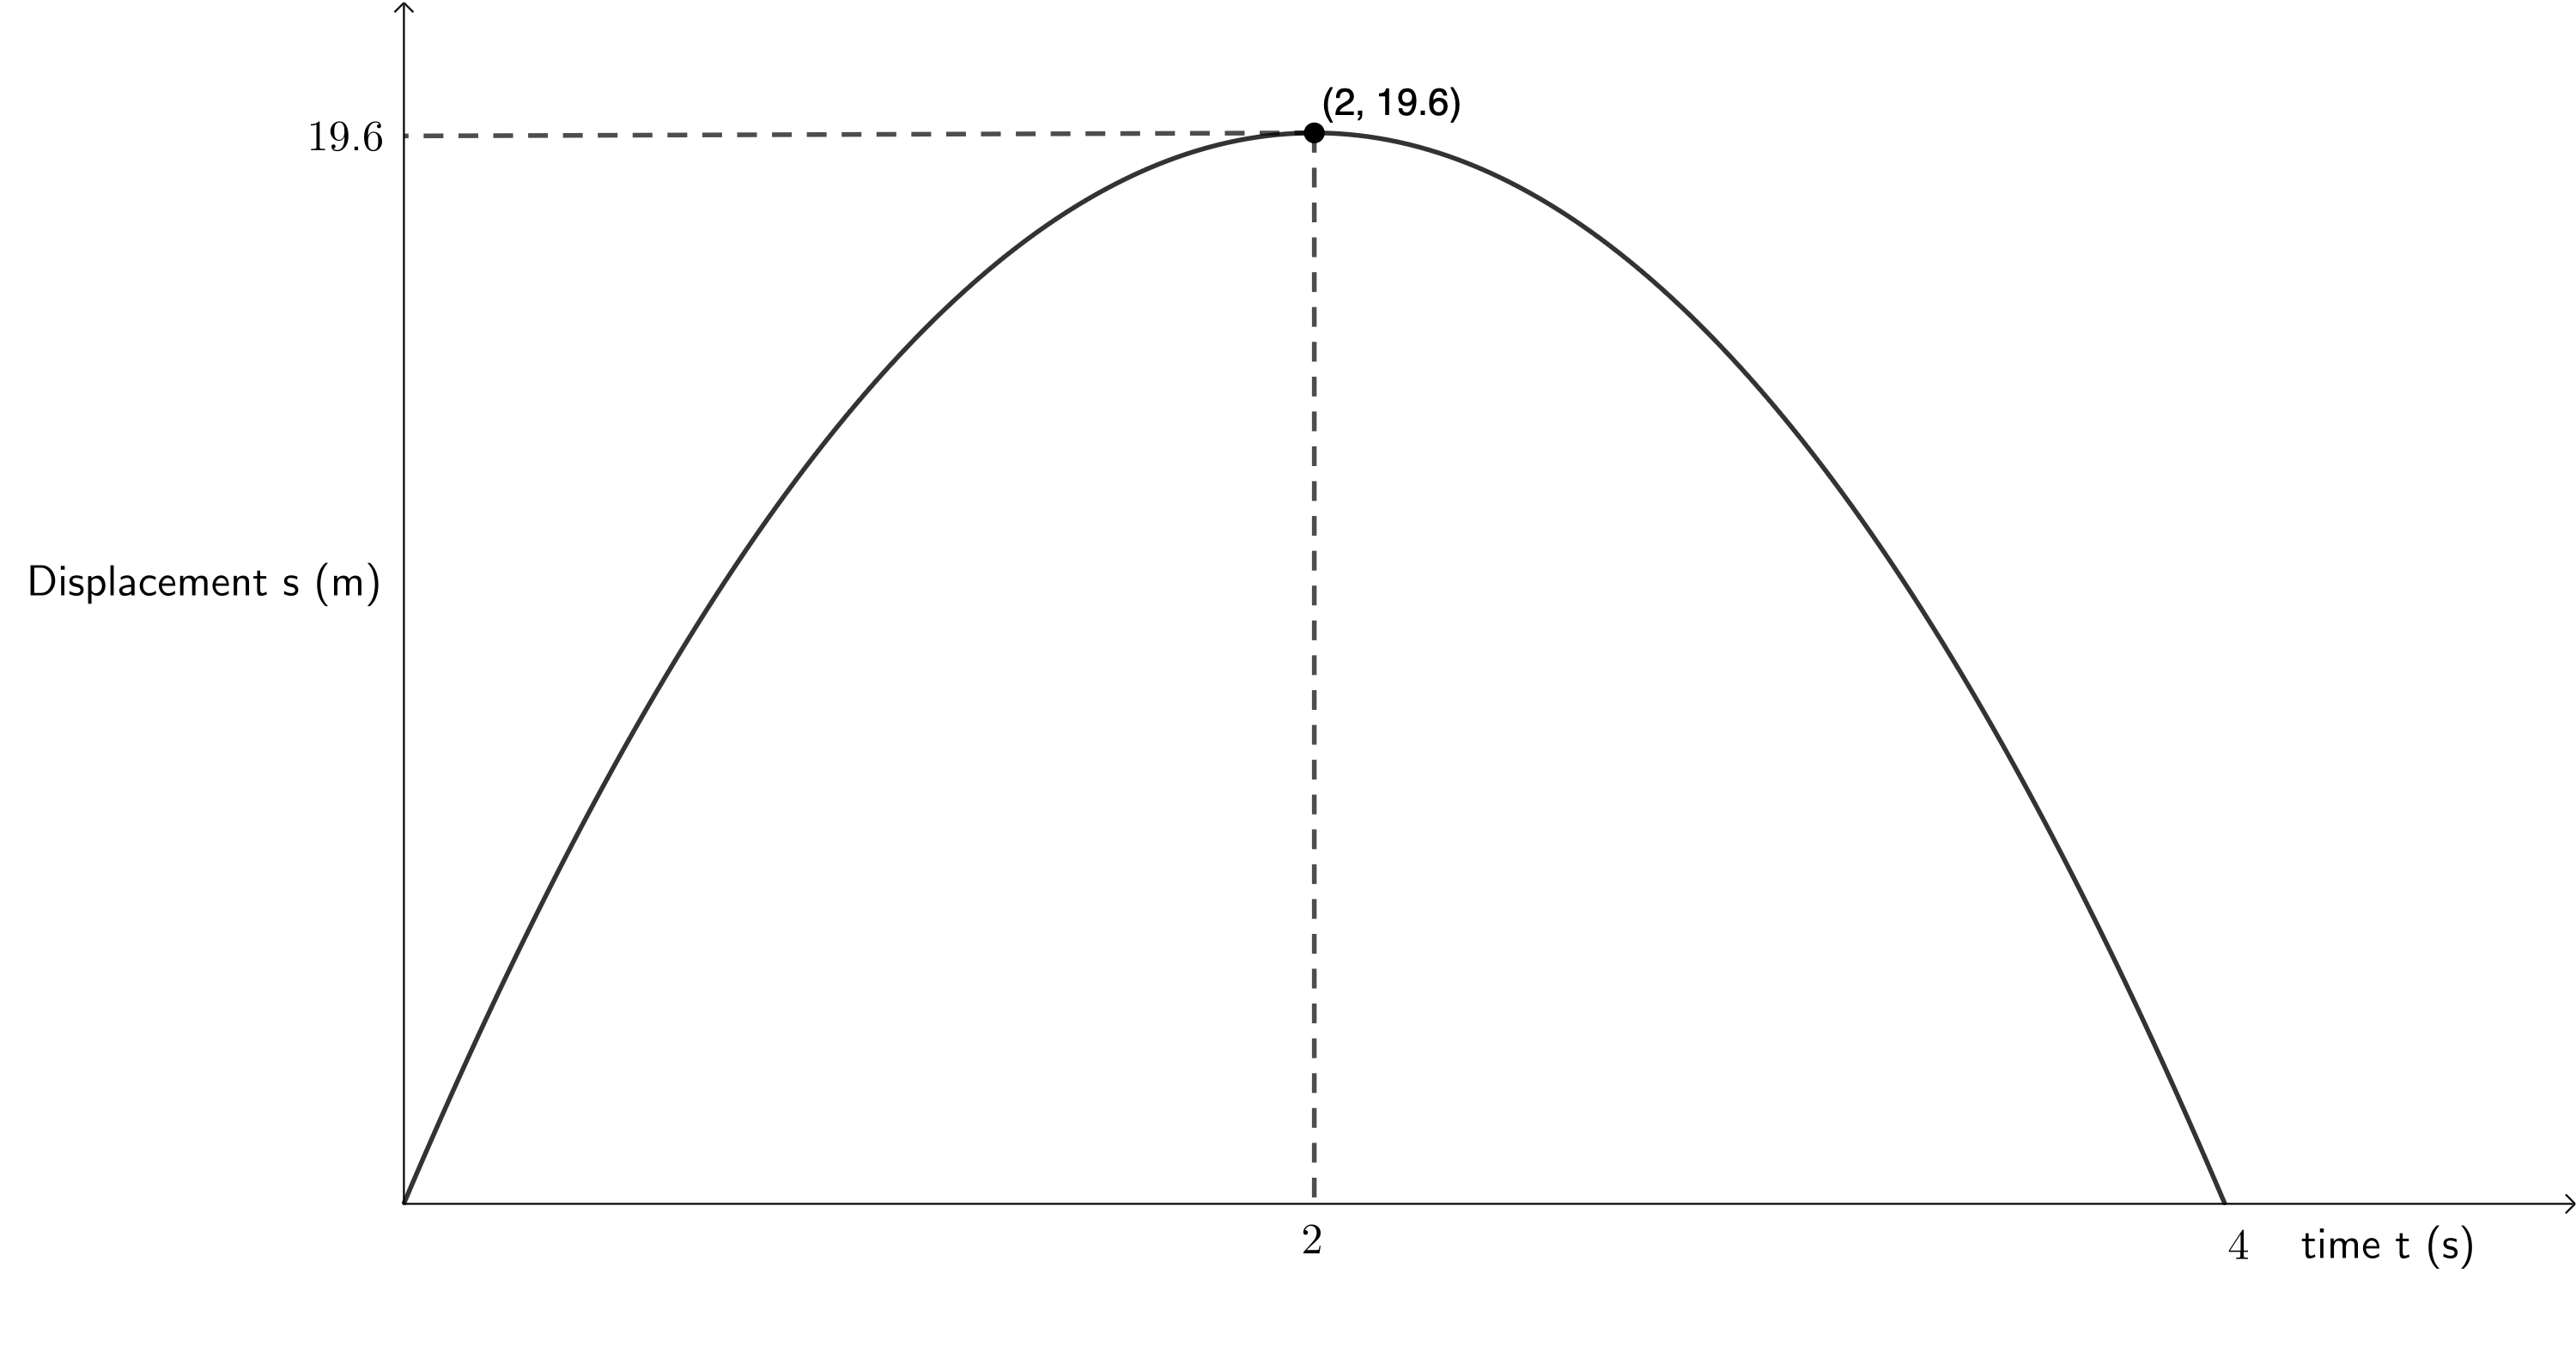
- Draw a sketch graph of the corresponding displacement-time graph. Label the axes.
- Draw a sketch graph of the corresponding acceleration-time graph. Label the axes.
Solutions
- If we look at the velocity-time graph we can see that the slope is negative. This immediately tells us that down is negative and up is positive. The ball starts off with a positive velocity of [latex]\scriptsize 19.6~\text{m.s}^{-1}[/latex]. Therefore, the ball initially travels up in the air. After [latex]\scriptsize 2~\text{s}[/latex], the velocity of the ball is [latex]\scriptsize 0~\text{m.s}^{-1}[/latex]. Therefore, at [latex]\scriptsize 2~\text{s}[/latex] the ball reaches its maximum height and starts to fall down, travelling with an increasing but negative velocity. At [latex]\scriptsize 4~\text{s}[/latex], the ball’s velocity is [latex]\scriptsize -19.6~\text{m.s}^{-1}[/latex] (the same magnitude as its initial velocity) and so the ball is at the same height as where it started from, in this case the ground. The ball has returned to its starting position.
- The only additional piece of information we need to draw the displacement-time graph is the ball’s maximum height above the ground which we know is reached after [latex]\scriptsize 2~\text{s}[/latex]. We can calculate this using an equation of motion.
[latex]\scriptsize \begin {align*} v_i&=19.6~\text{m.s}^{-1}\\ a&=-9.8 \text~\text{m.s}^{-2}\\ t&=2~\text{s}\\ s&=v_it+\displaystyle \frac{1}{2}at^2\\ &=19.6~\text{m} \end{align*}[/latex]
.
Alternatively, we can calculate the area under the given velocity-time graph between [latex]\scriptsize t=0~\text{s}[/latex] and [latex]\scriptsize t = 2~\text{s}[/latex].
.
[latex]\scriptsize \begin{align*} Area &= \displaystyle \frac{1}{2}\times b\times h\\ &=\displaystyle \frac{1}{2}\times 2~\text{s}\times 19.6~\text{m.s}^{-1}\\ &=19.6~\text{m} \end{align*}[/latex]
.
We can see from the velocity-time graph that the total area under the graph between [latex]\scriptsize t = 0~\text{s}[/latex] and [latex]\scriptsize t = 4~\text{s}[/latex] is [latex]\scriptsize 0~\text{m}[/latex]. In other words, this is confirmation that the ball’s total displacement is [latex]\scriptsize 0~\text{m}[/latex] and that the ball returns back to its starting point.
- Remember that the upwards is positive. Therefore, we need to represent acceleration due to gravity as [latex]\scriptsize -9.8~\text{m.s}^{-2}[/latex].
Exercise 2.1
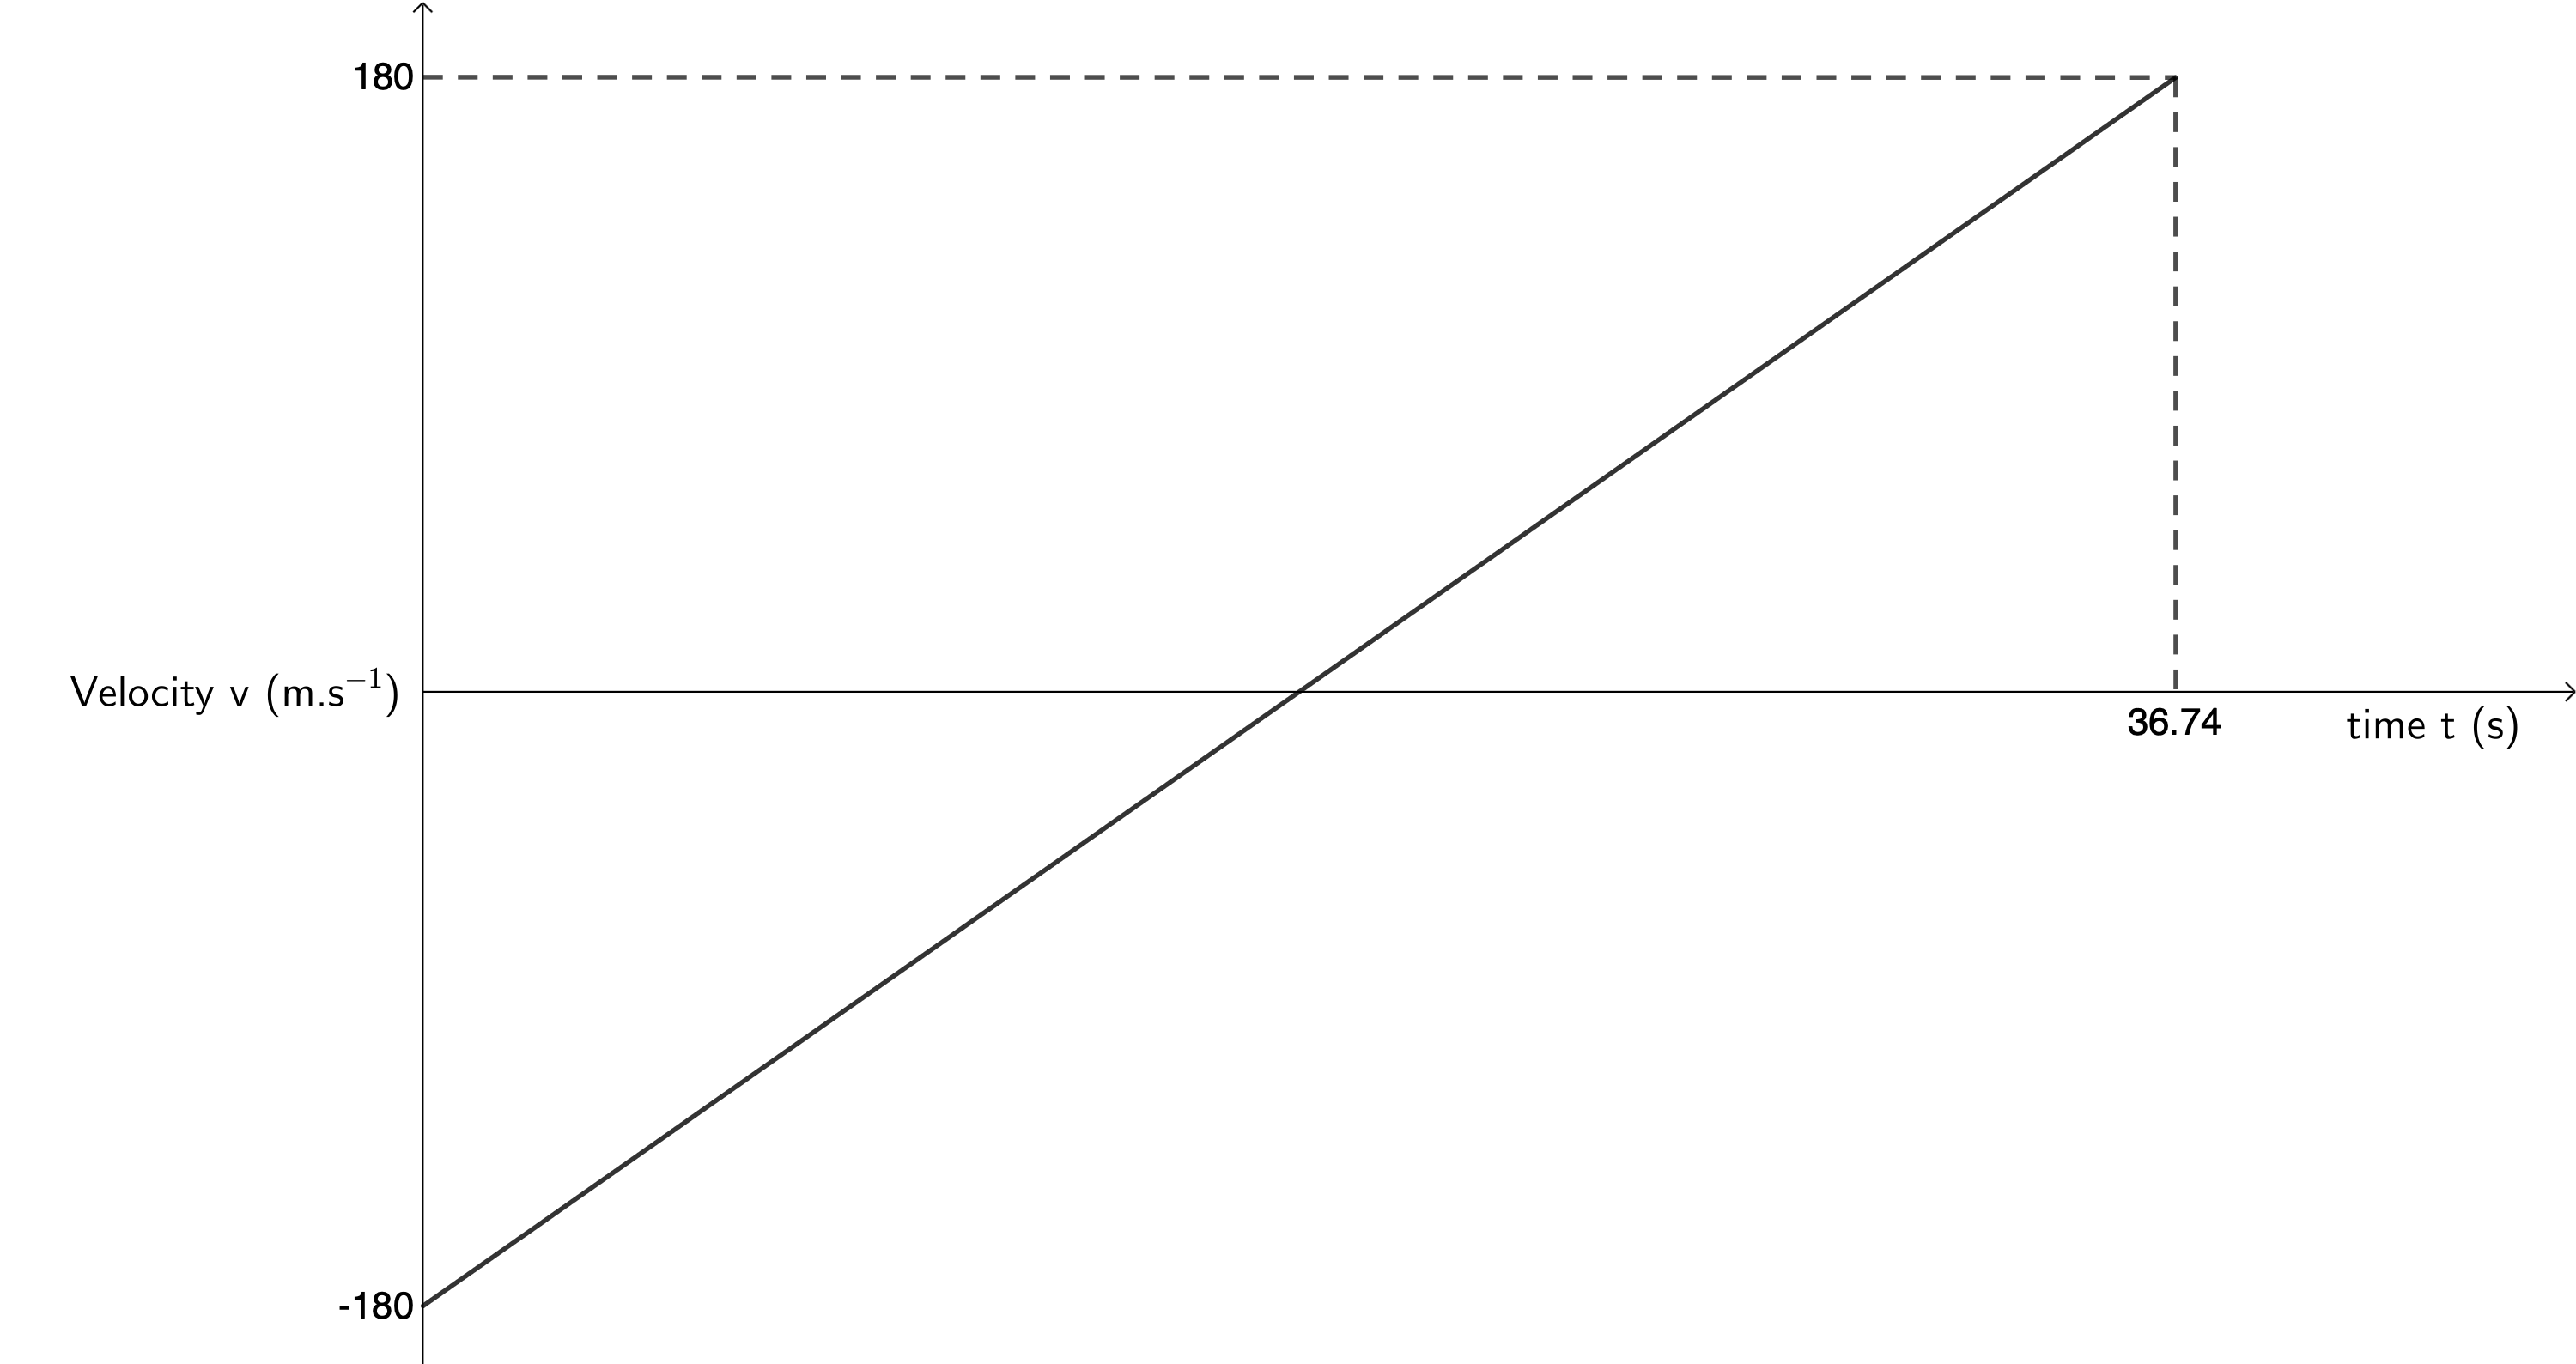
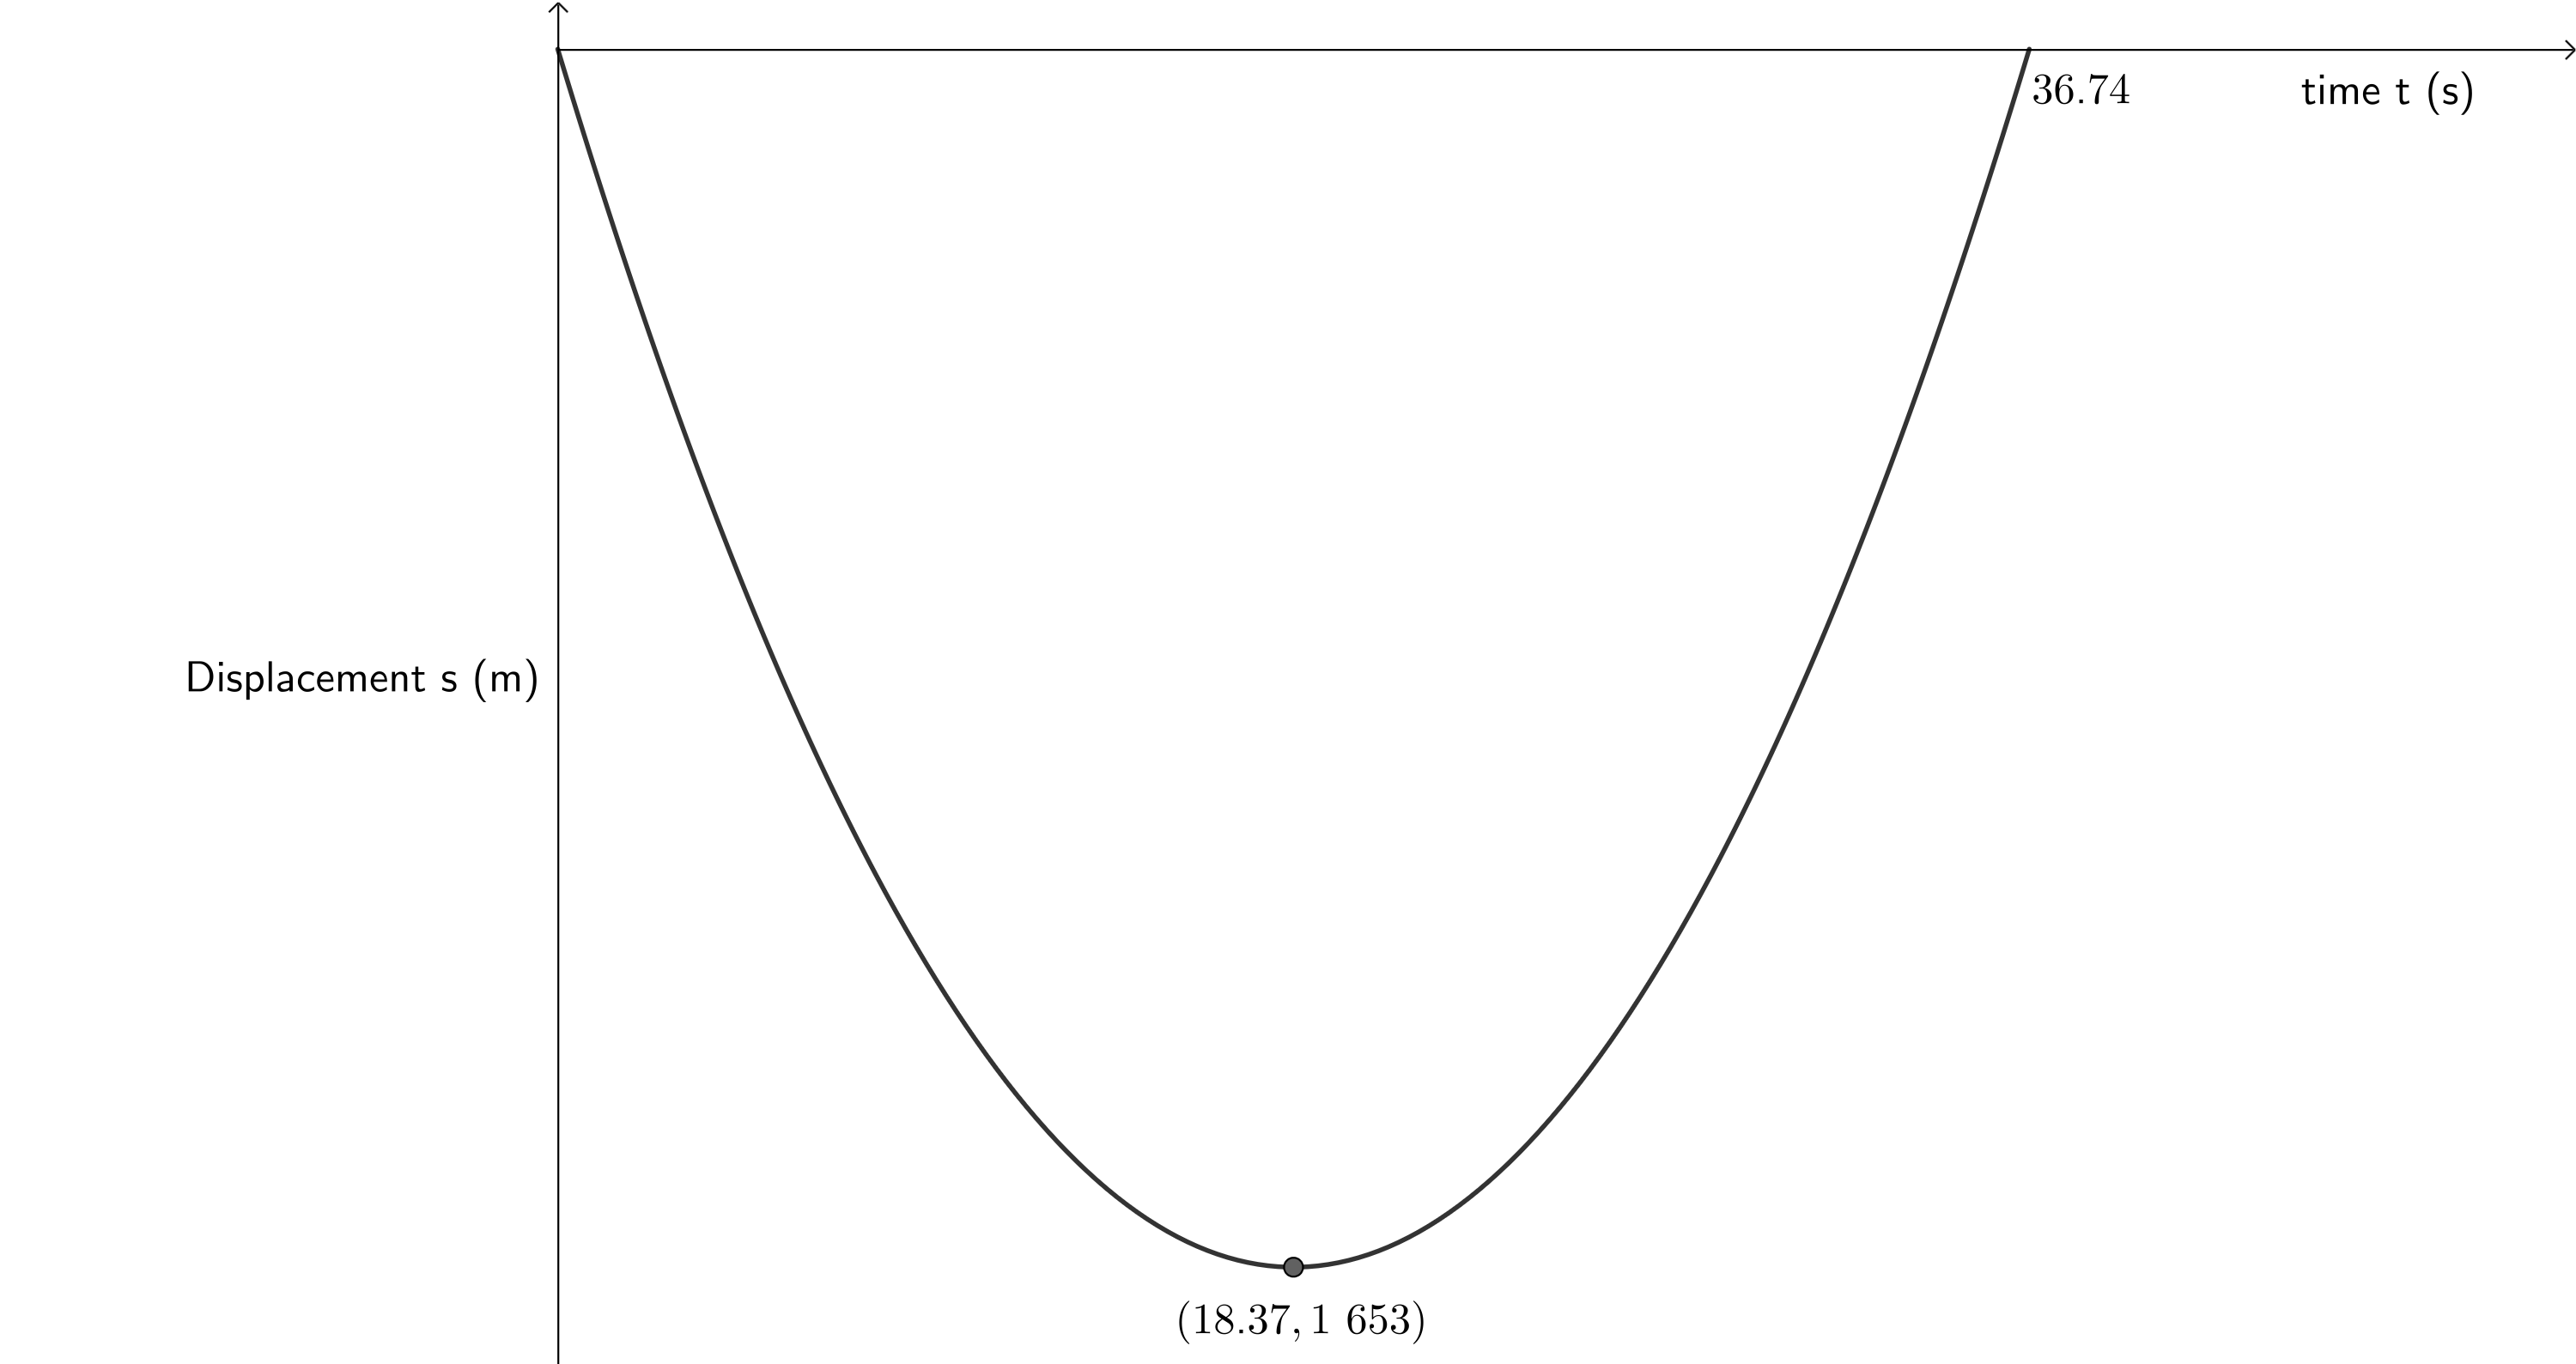
- The velocity-time graph below is of a bullet fired directly upwards from a gun. Downwards is assigned as the positive direction.
- Describe the motion of the bullet.
- Draw the corresponding displacement-time graph.
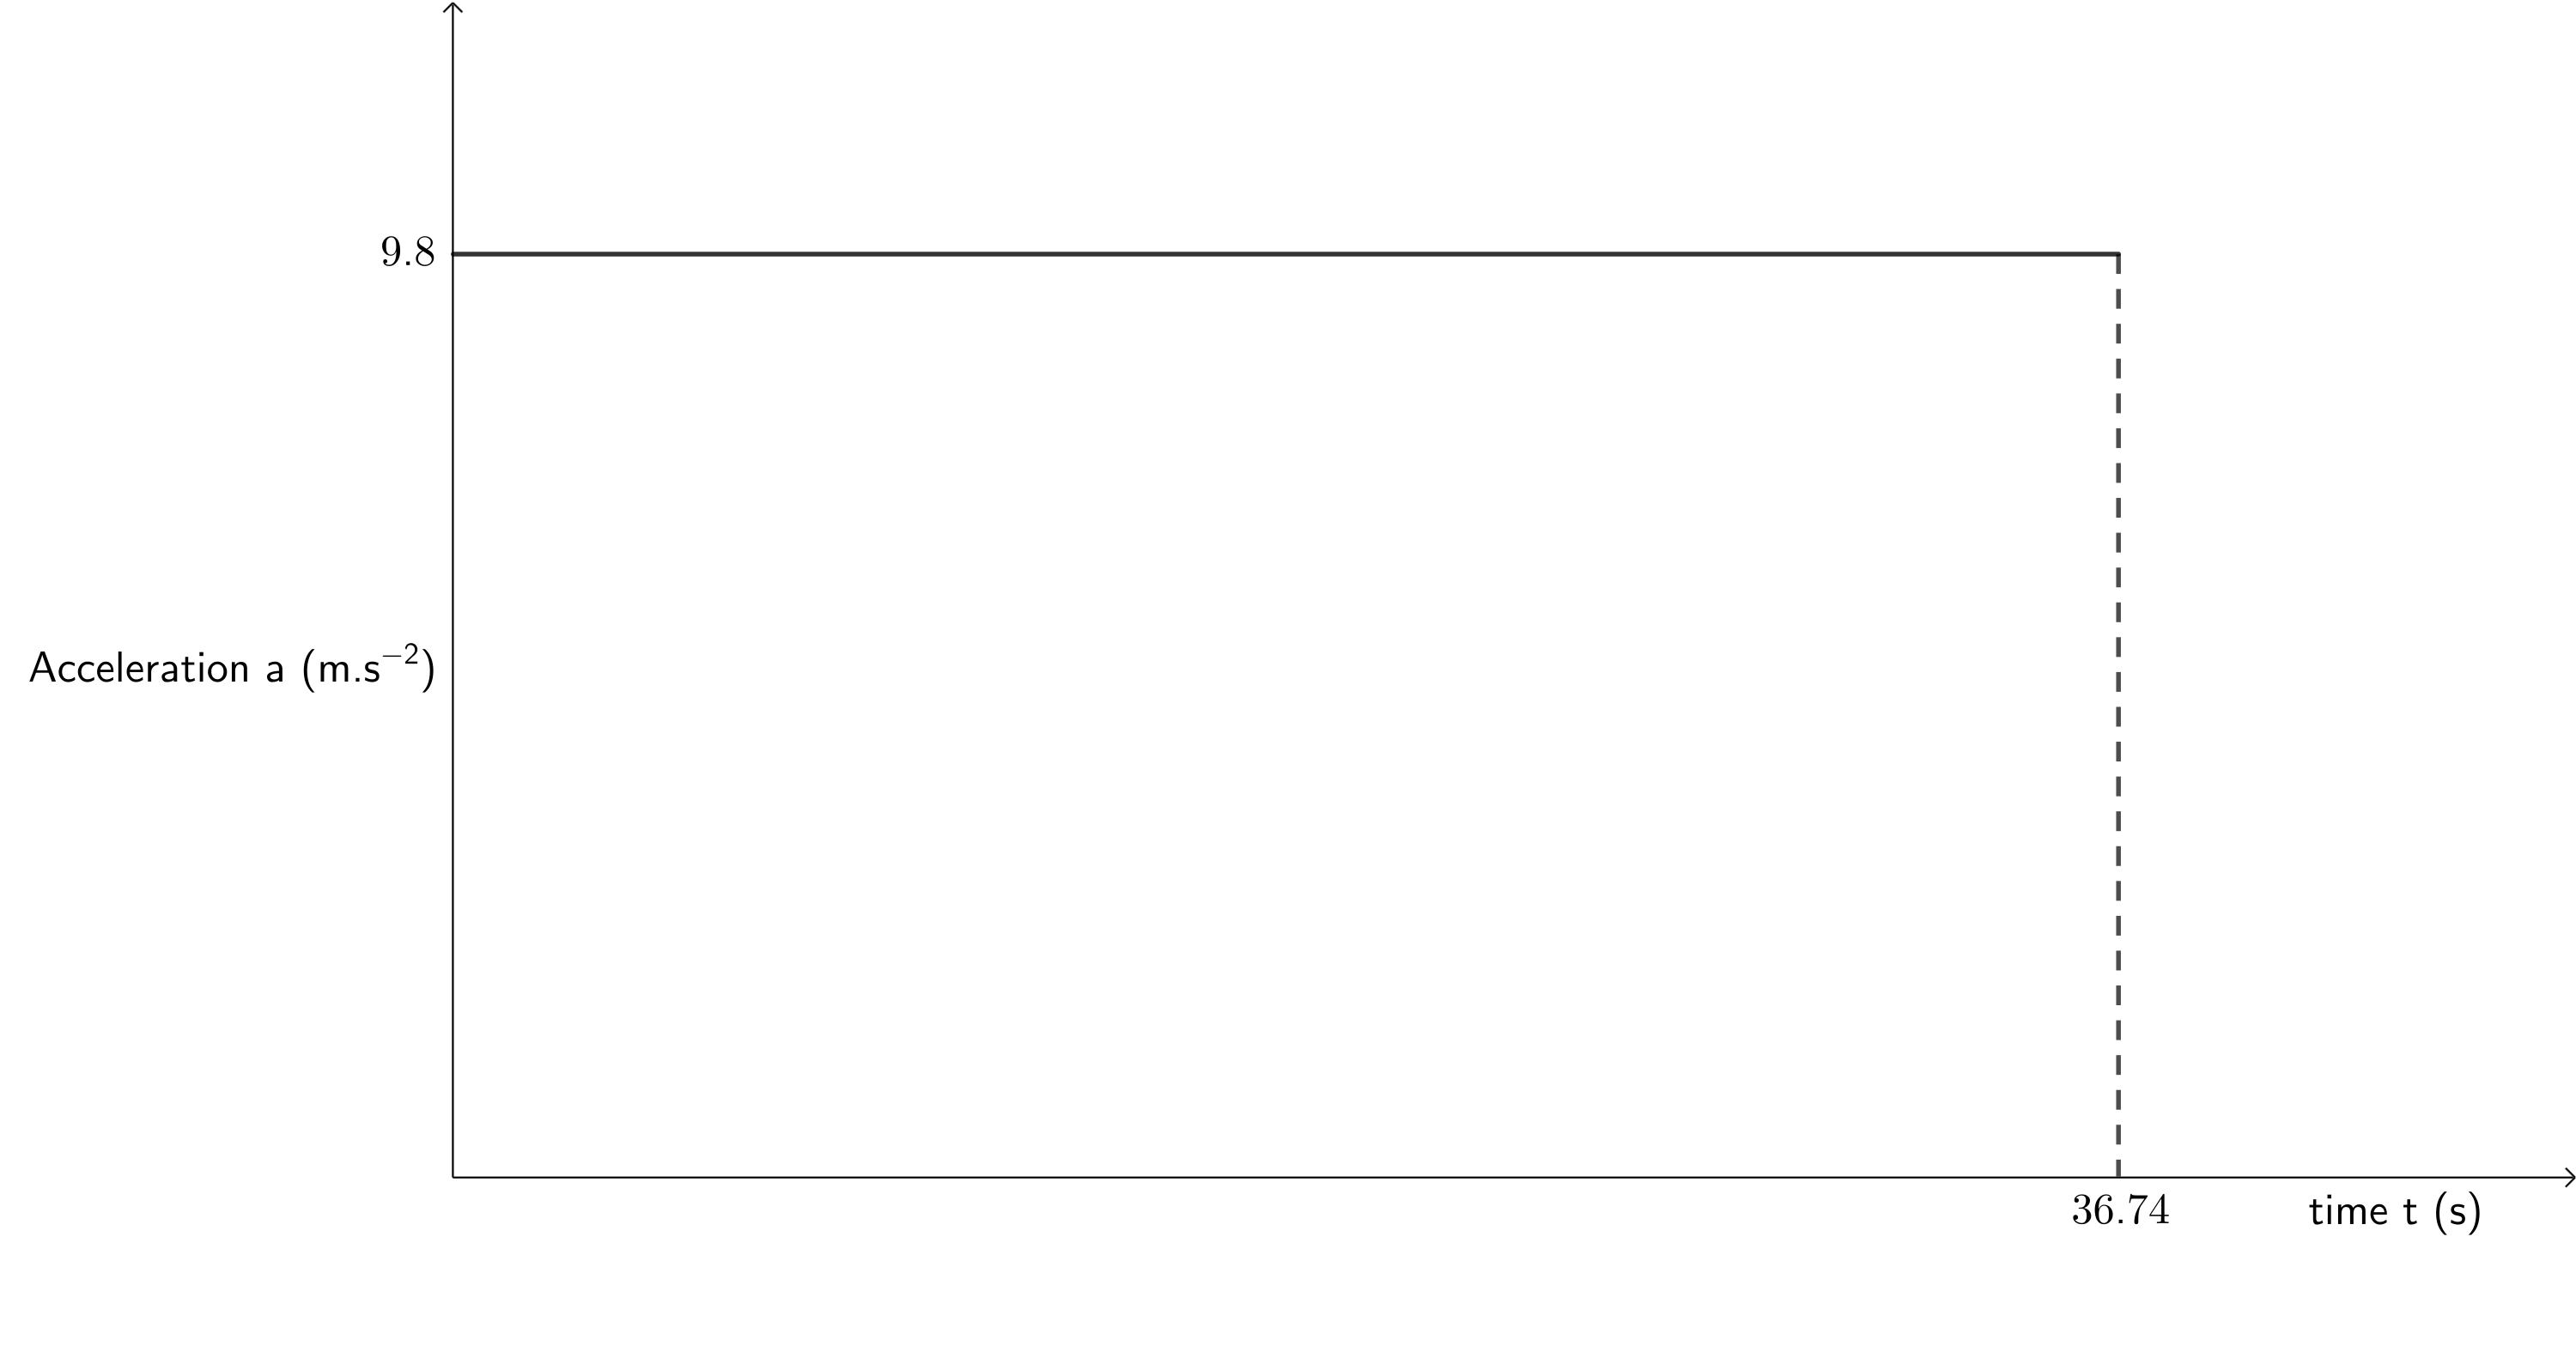
- Draw the corresponding acceleration-time graph.
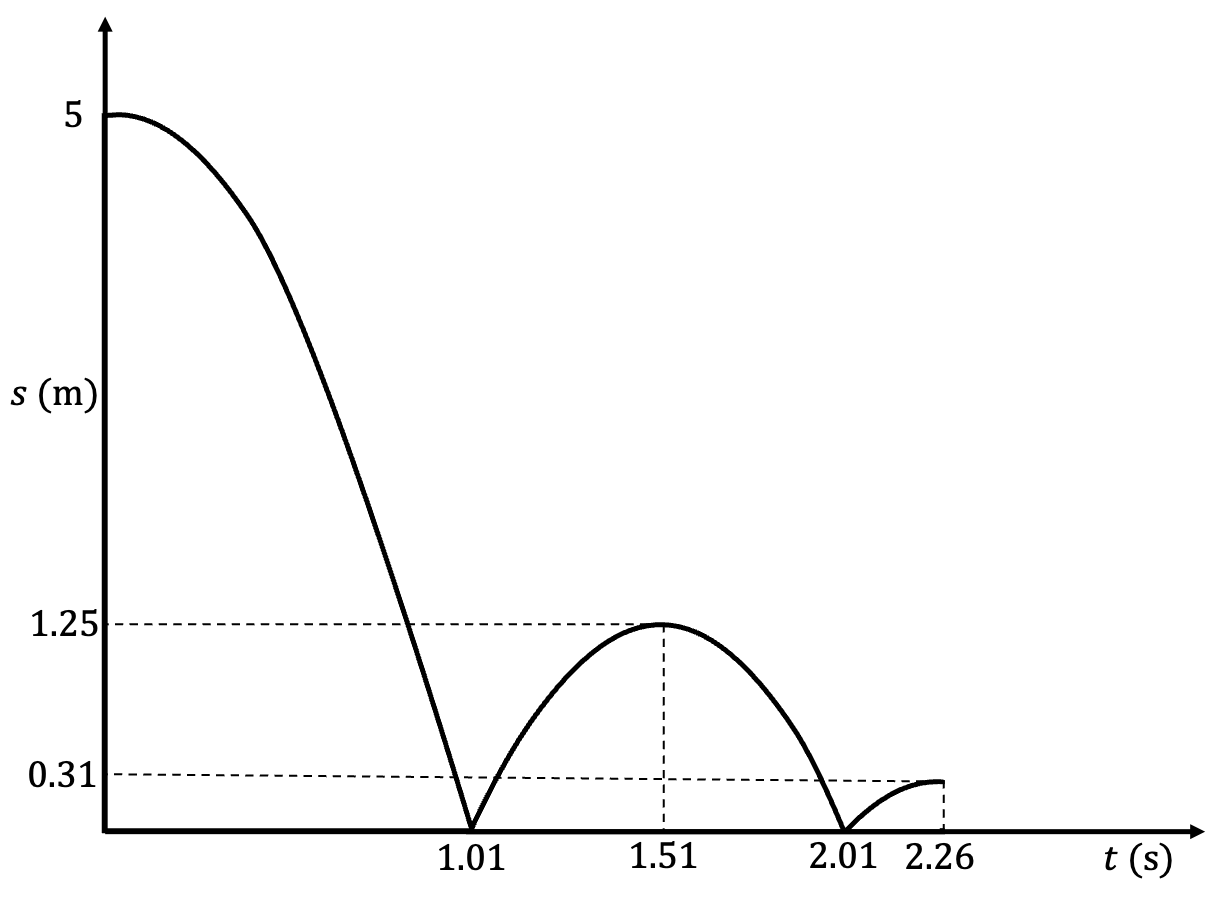
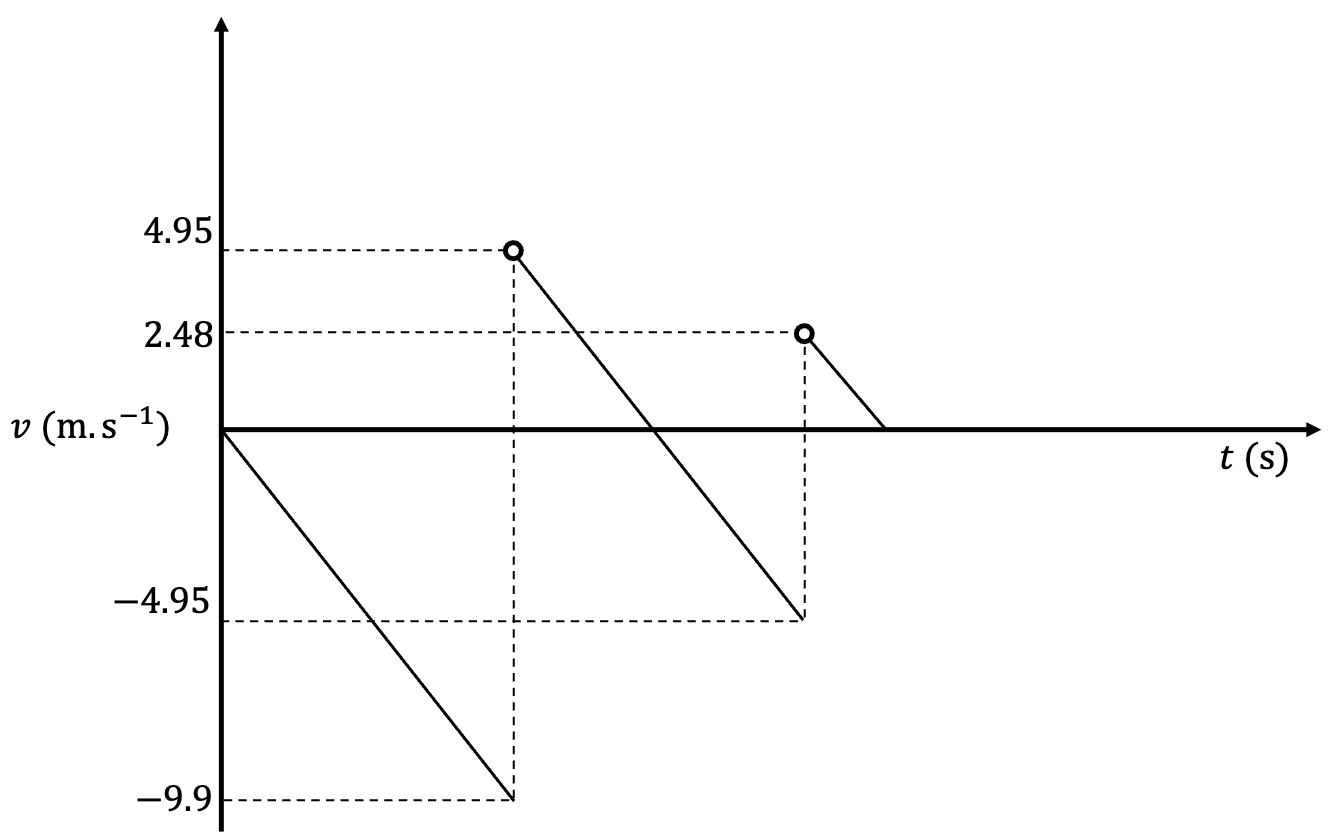
- A rubber ball is dropped from [latex]\scriptsize 5~\text{m}[/latex] above a hard concrete surface. Each time the ball bounces, the magnitude of the velocity in the upwards direction is half the magnitude of the velocity with which it hits the floor. The ball is allowed to bounce twice and is caught again as it reaches its maximum height after the second bounce. Draw the following graphs for the situation:
- Displacement-time
- Velocity-time
- Acceleration-time
The full solutions can be found at the end of the unit.
Summary
In this unit you have learnt the following:
- Graphs for vertical projectile motion are similar to graphs for horizontal motion at constant acceleration.
Unit 2: Assessment
Suggested time to complete: 30 minutes
Question 1 adapted from NC(V) Level 4 Physical Science Paper 1 November 2019 question 6
- A hot-air balloon is rising vertically at constant velocity. When the balloon is at a height of [latex]\scriptsize 88~\text{m}[/latex] above the ground, a stone (mass [latex]\scriptsize 200~\text{g}[/latex]) is dropped from the balloon. The displacement-time graph below represents the motion of the stone from the moment it is released from the balloon until the stone strikes the ground. Ignore the effect of air resistance.
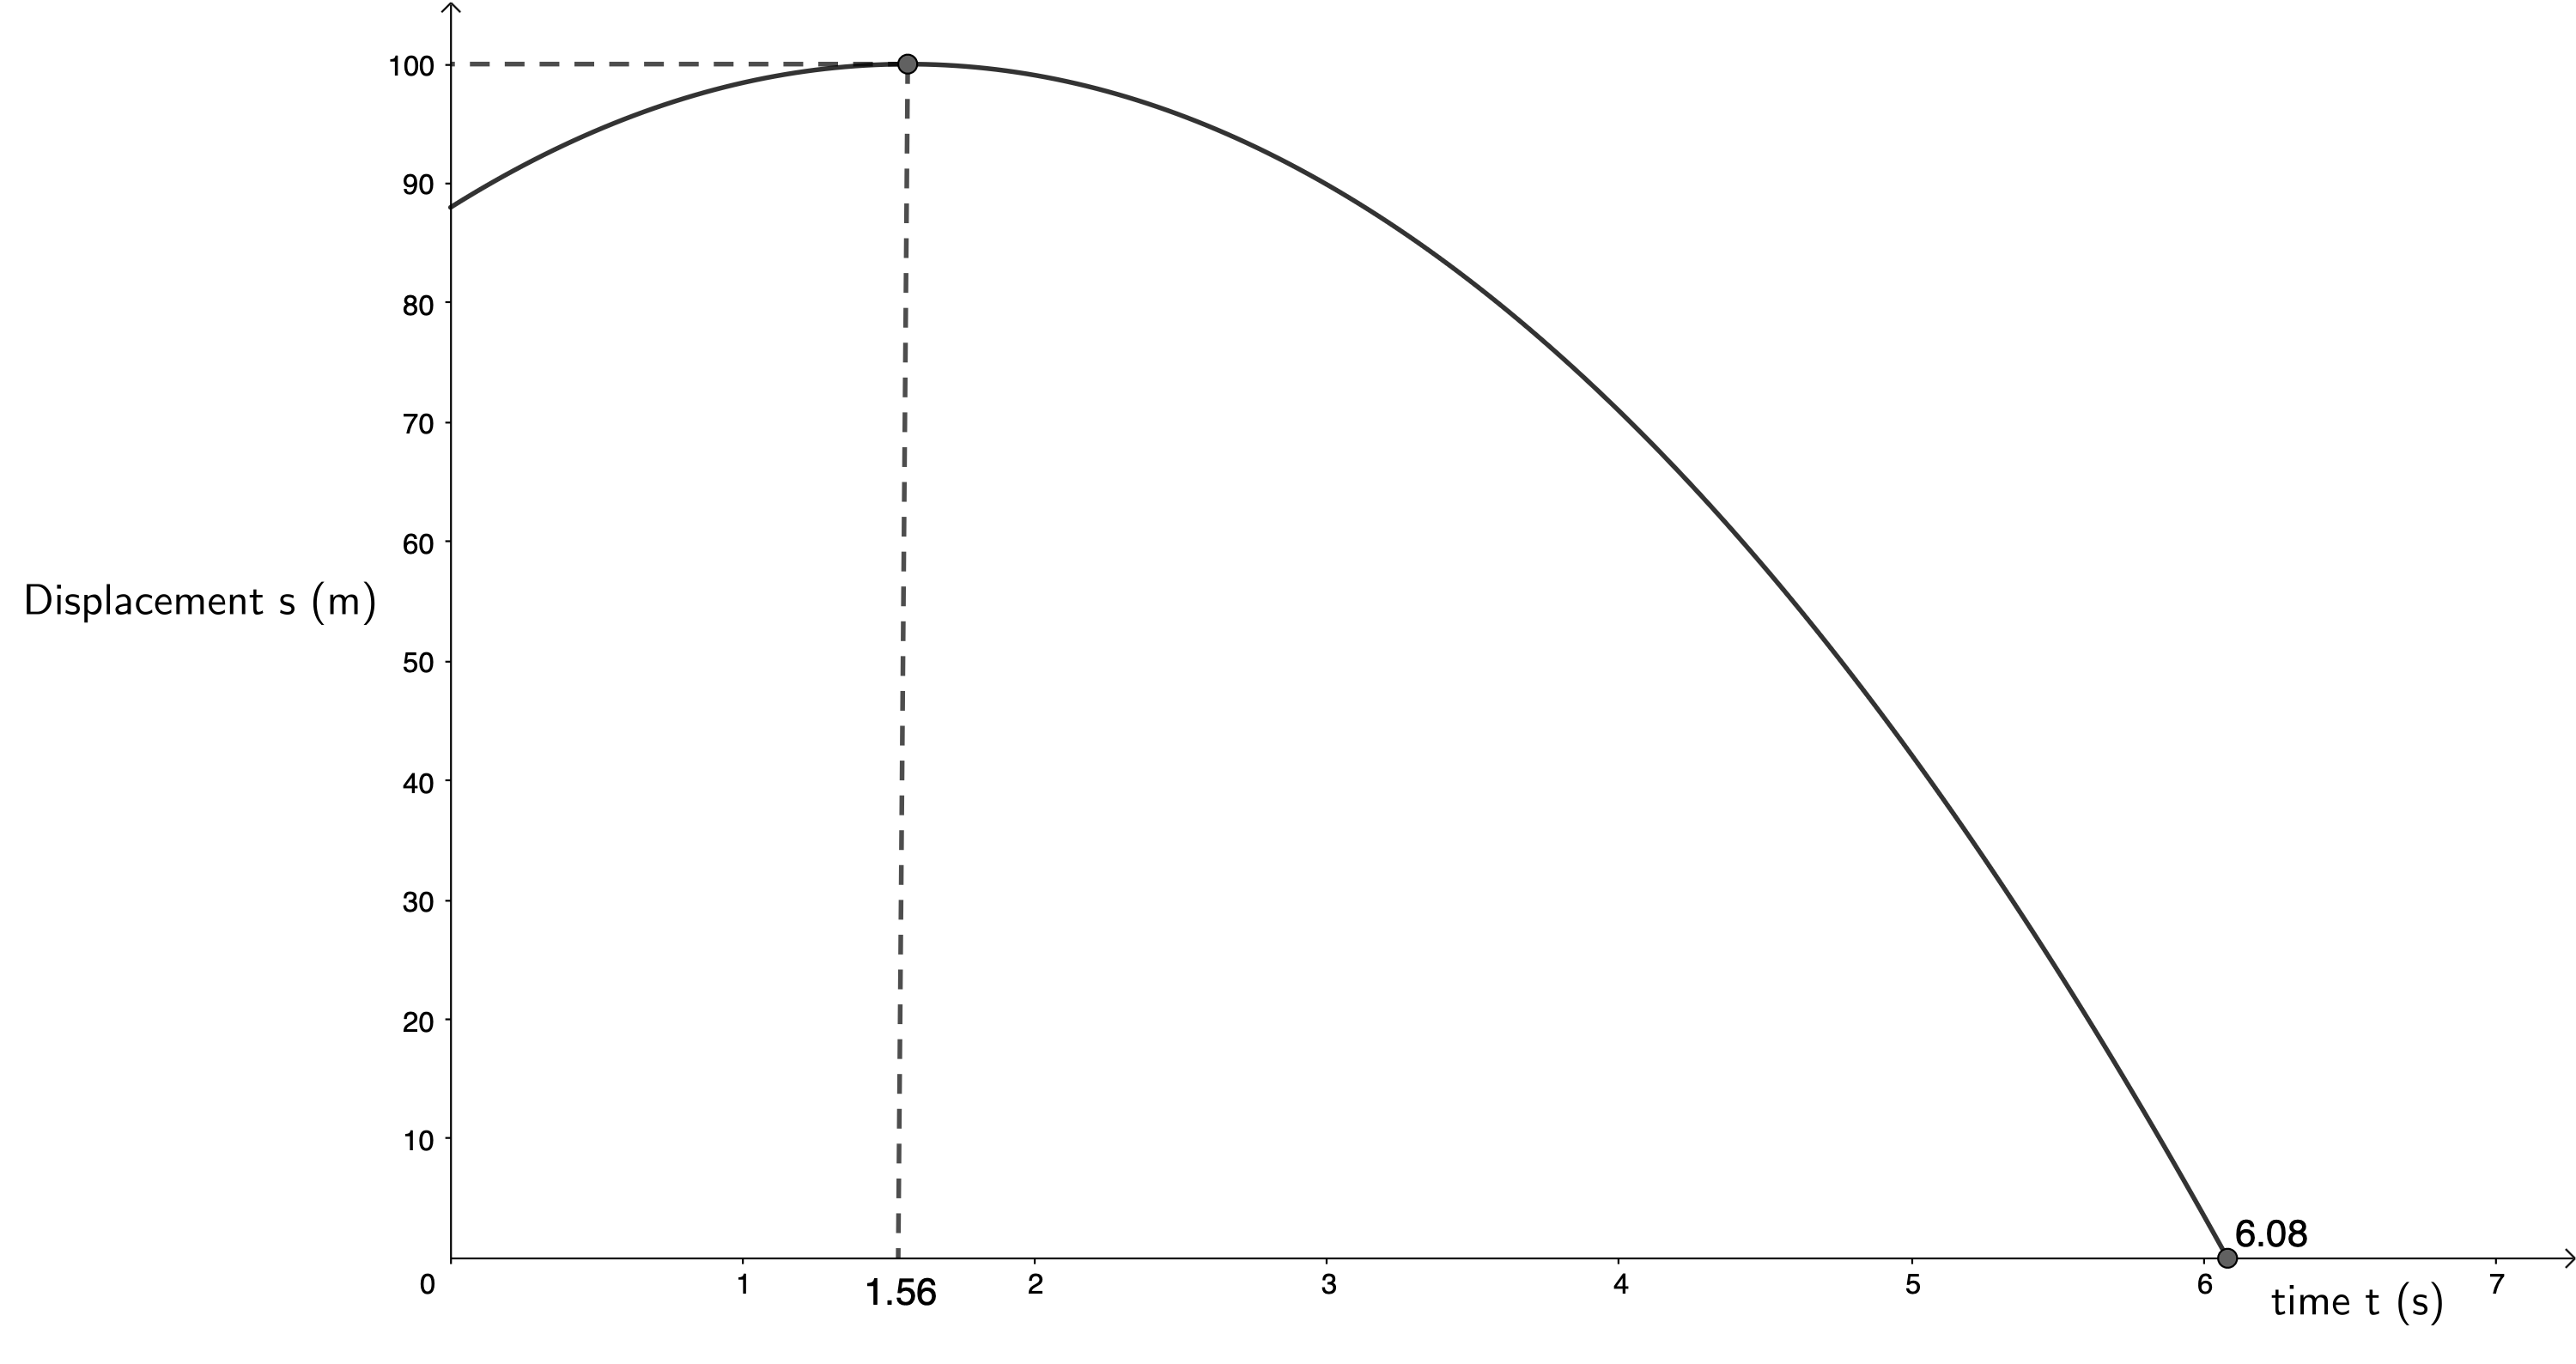
Use the information supplied in the graph to answer the following questions.- Calculate the gravitational potential energy of the stone the instant it is dropped from the balloon.
- State the velocity of the stone when it reaches its maximum height above the ground.
- Calculate the velocity of the stone the instant it strikes the ground.
- Calculate the velocity of the hot-air balloon the instant the stone is dropped from the balloon.
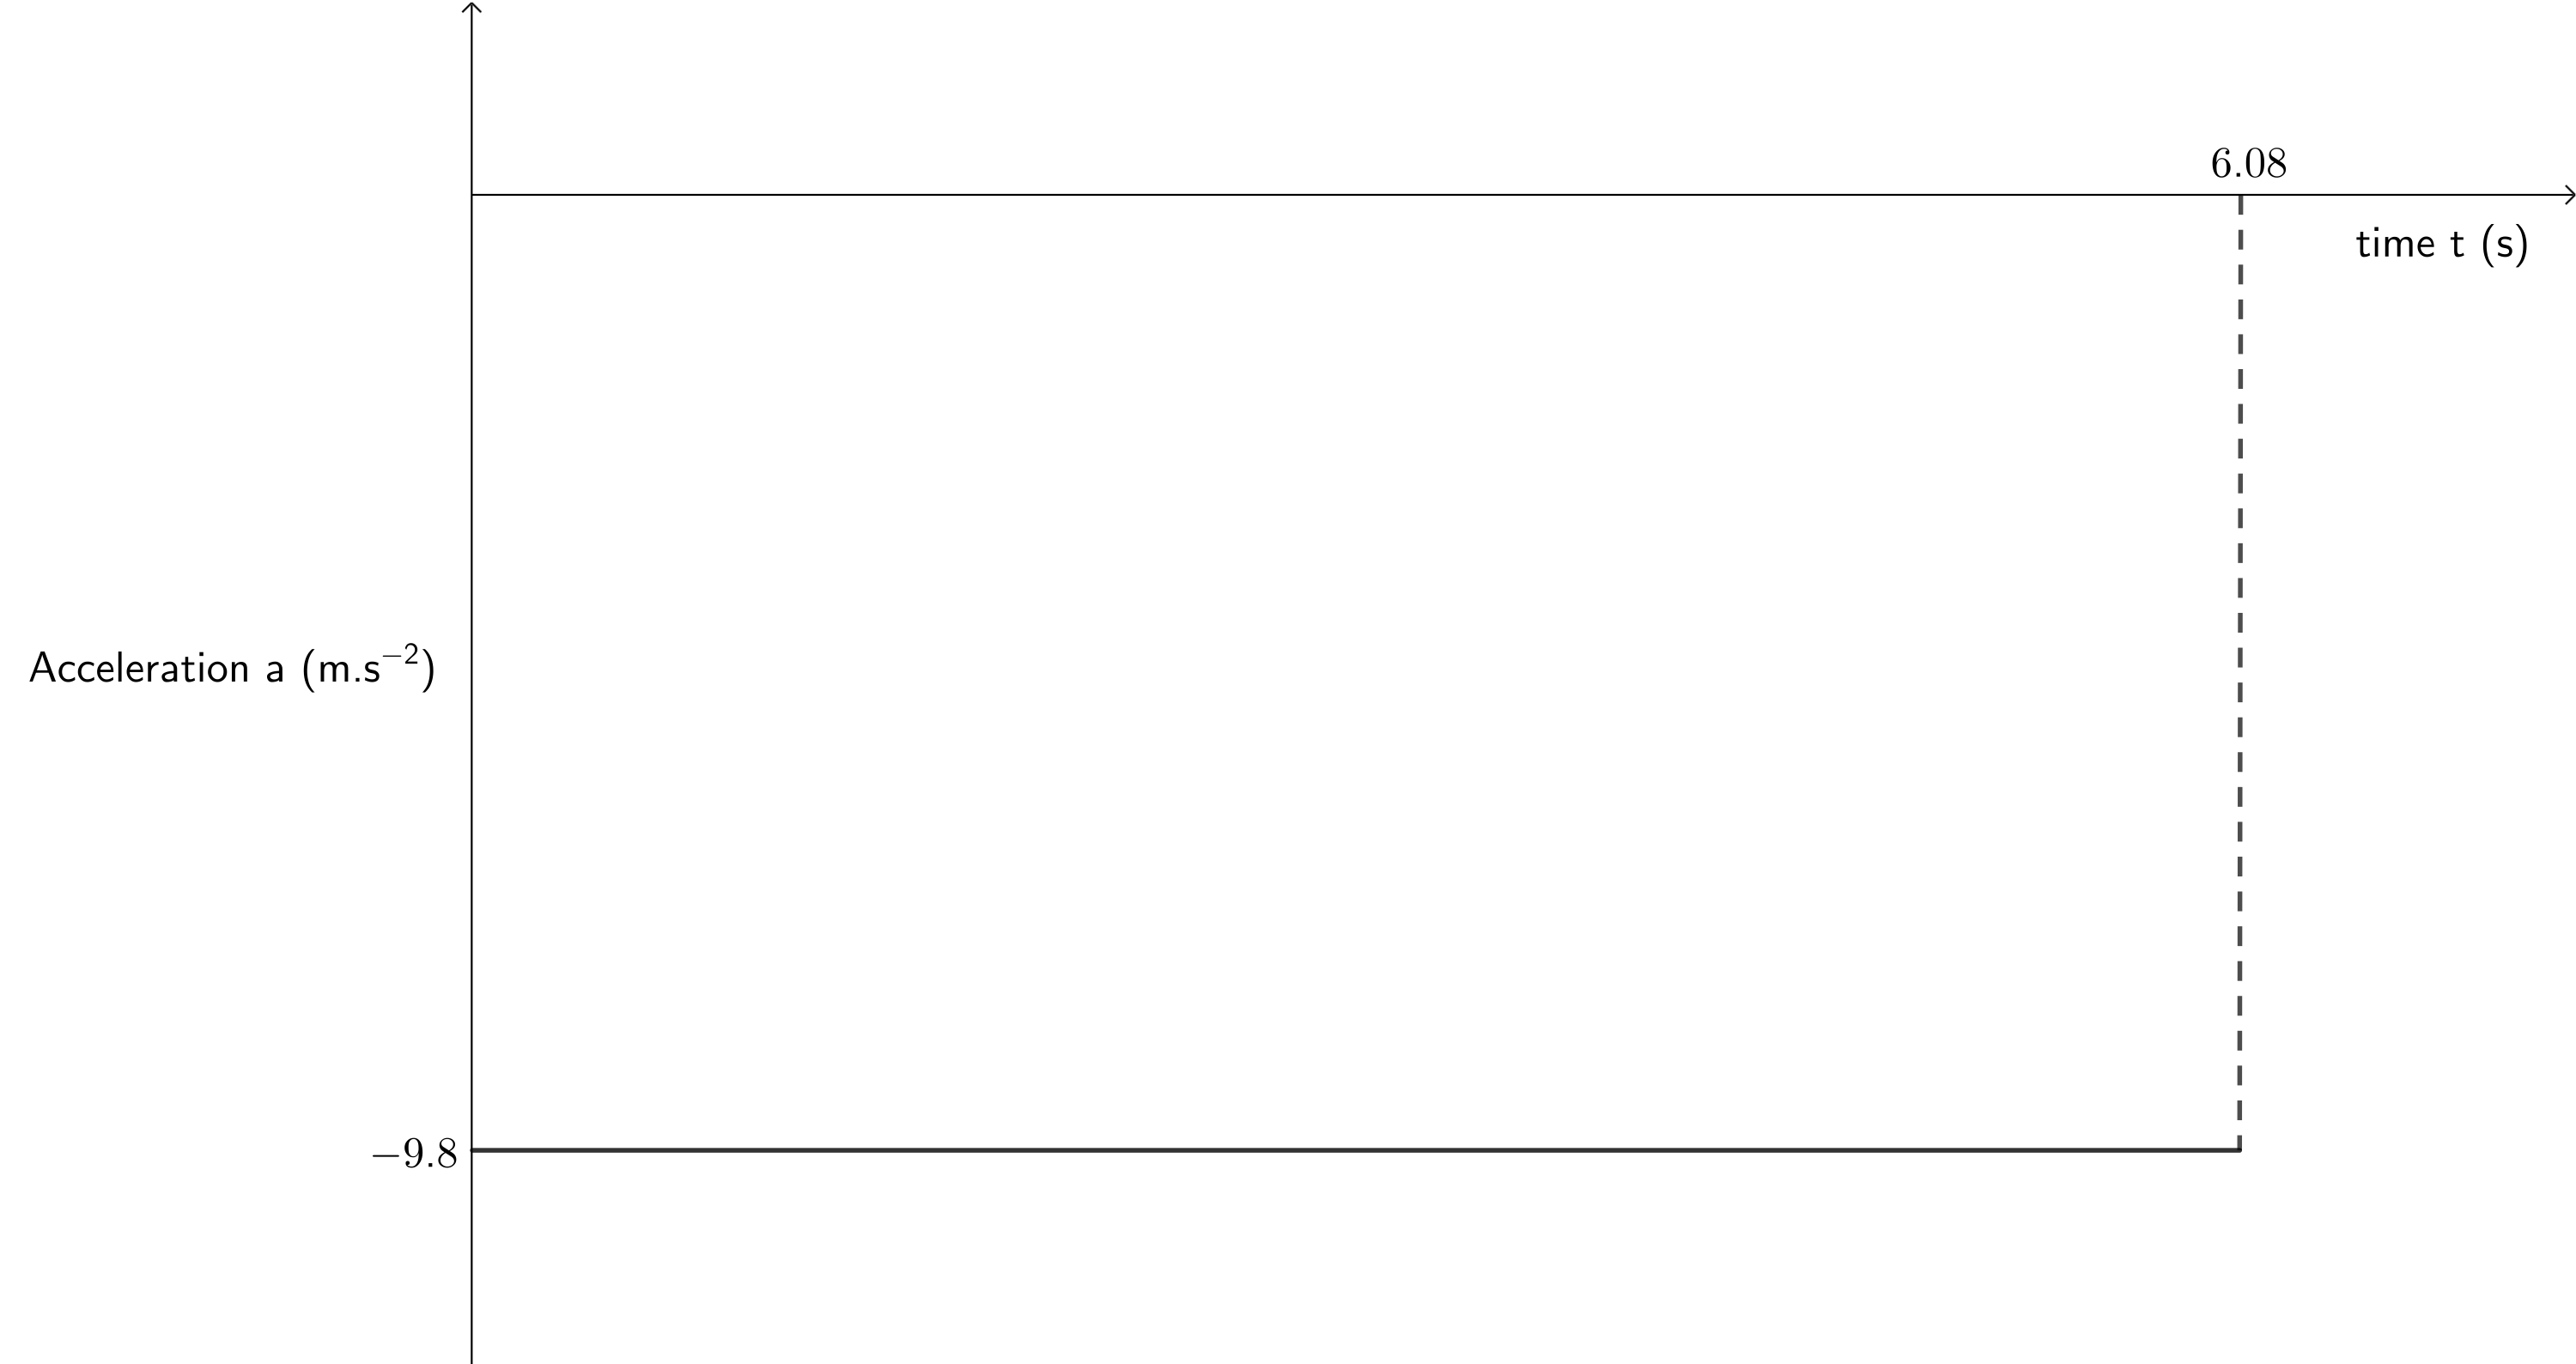
- Draw a rough acceleration versus time graph for the motion of the stone.
- The velocity-time graph below shows the motion of an object. Upwards is the positive direction.
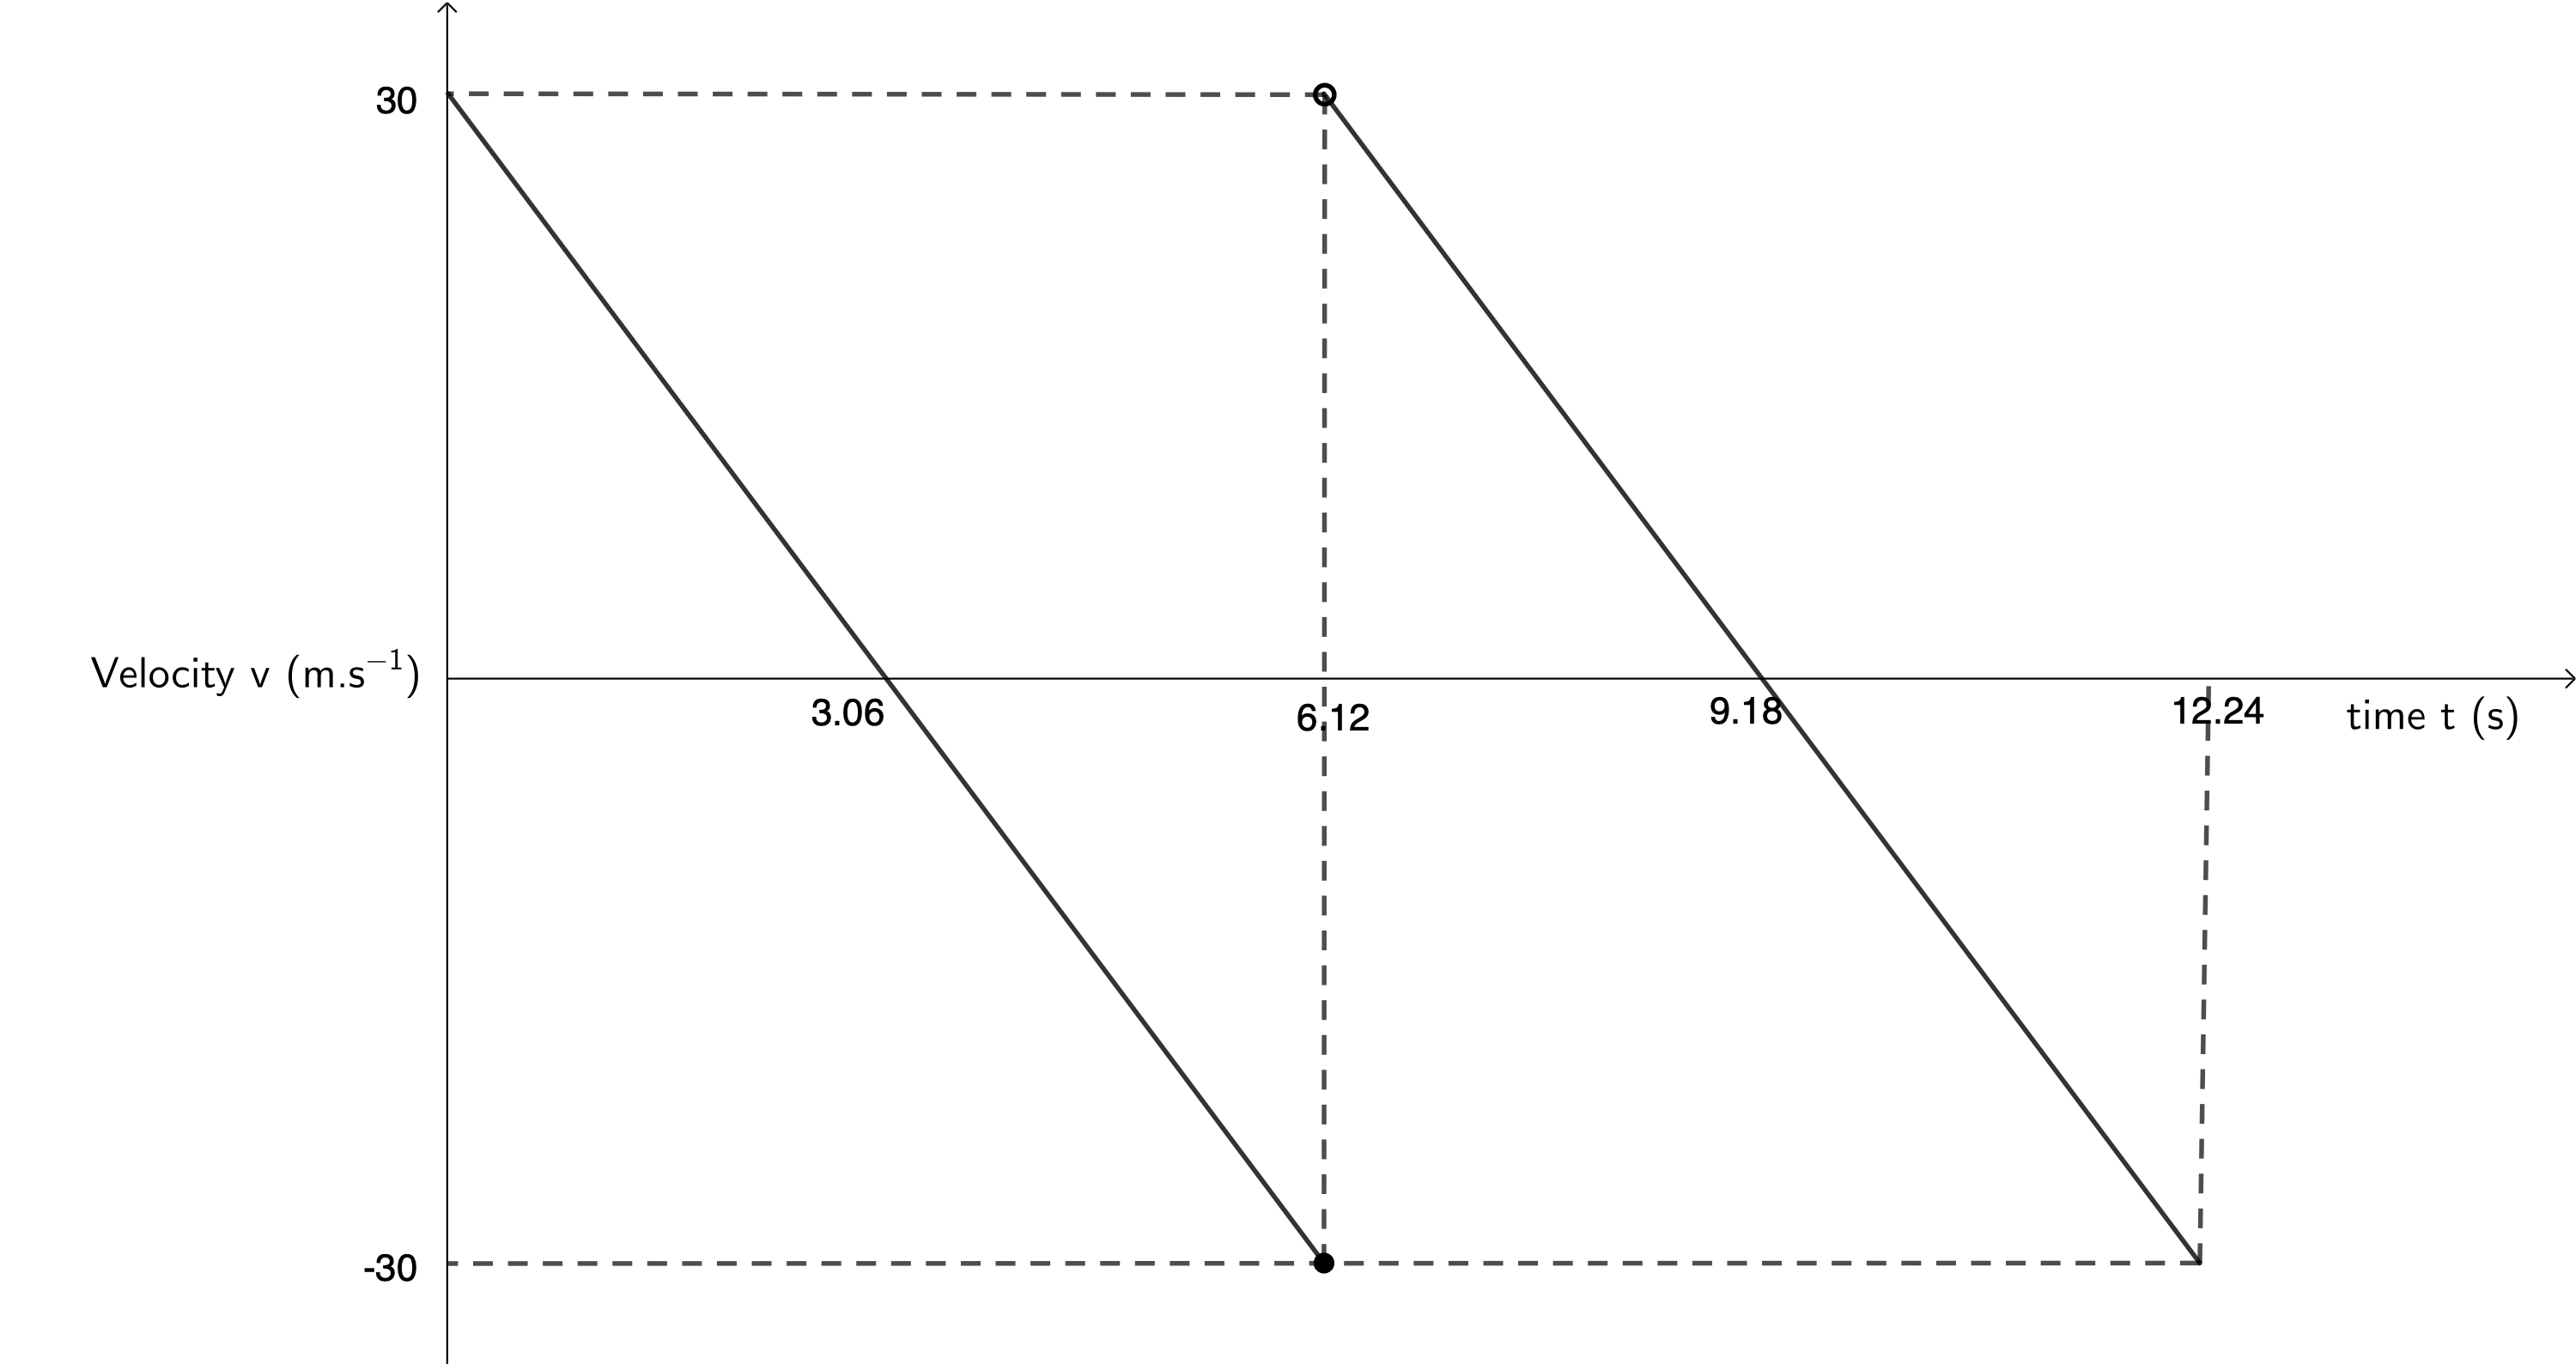
- Describe the motion of this object.
- Plot the corresponding displacement-time graph.
- Plot the corresponding acceleration-time graph.
The full solutions can be found at the end of the unit.
Unit 2: Solutions
Exercise 2.1
- .
- The initial velocity of the bullet is [latex]\scriptsize -180~\text{m.s}^{-1}[/latex]. This is upwards (in the negative direction). The bullet’s velocity decreases due to the constant downwards (positive) acceleration due to gravity, until after a certain time its velocity is zero. This is the point where it reaches its maximum height. Thereafter, also because of the constant positive acceleration due to gravity, the bullet starts to fall back to the ground. As it does so, its velocity increases, until at [latex]\scriptsize 36.74~\text{s}[/latex], its velocity is [latex]\scriptsize 180~\text{m.s}^{-1}[/latex], the same magnitude with which it was initially fired. This means that the bullet is at the same height from which it was fired and its total displacement is [latex]\scriptsize 0~\text{m}[/latex].
- The velocity-time graph shows time symmetry. Therefore, we know that the time after which the bullet decelerates to [latex]\scriptsize 0~\text{m.s}^{-1}[/latex] is exactly half the time it takes to achieve a velocity of [latex]\scriptsize 180~\text{m.s}^{-1}[/latex]. Therefore, the bullet reaches its maximum height after [latex]\scriptsize \displaystyle \frac{36.74~\text{s}}{2} = 18.37~\text{s}[/latex].
.
The maximum height of the bullet:
[latex]\scriptsize \begin {align*} v_i&=180~\text{m.s}^{-1}\\ a&=-9.8 \text~\text{m.s}^{-2}\\ t&=18.37~\text{s}\\ s&=v_it+\displaystyle \frac{1}{2}at^2\\ &=-1~653~\text{m} \end{align*}[/latex]
.
Note: The displacement is negative because we assigned downwards as positive as the bullet has travelled upwards.
- Draw the corresponding acceleration-time graph.
- .
- Let upwards be positive.
.
Velocity with which the ball first strikes the ground:
[latex]\scriptsize \begin {align*} v_i&=0~\text{m.s}^{-1}\\ a&=-9.8 \text~\text{m.s}^{-2}\\ s&=-5~\text{m}\\ {v_f}^2&={v_i}^2+2as\\ \therefore v_f&=\sqrt{{v_i}^2+2as}\\ &=-9.9~\text{m.s}^{-1} \end{align*}[/latex]
.
The time taken for the ball to first strike the ground
[latex]\scriptsize \begin {align*} v_i&=0~\text{m.s}^{-1}\\ v_f&=-9.9~\text{m.s}^{-1}\\ a&=-9.8 \text~\text{m.s}^{-2}\\ v_f&=v_i+at\\ \therefore t&=\displaystyle \frac{v_f-v_i}{a}\\ &=1.01~\text{s} \end{align*}[/latex]
.
The initial velocity after the first bounce is [latex]\scriptsize \displaystyle \frac{9.9~\text{m.s}^{-1}}{2} = 4.95~\text{m.s}^{-1}[/latex].
.
The max height reached by the ball after its first bounce:
[latex]\scriptsize \begin {align*} v_i&=4.95~\text{m.s}^{-1}\\ v_f&=0~\text{m.s}^{-1}\\ a&=-9.8 \text~\text{m.s}^{-2}\\ {v_f}^2&={v_i}^2+as\\ \therefore s&=\displaystyle \frac{{v_f}^2-{v_i}^2}{2a}\\ &=1.25~\text{m} \end{align*}[/latex]
.
The time taken for the ball to reach maximum height after its first bounce:
[latex]\scriptsize \begin {align*} v_i&=4.95~\text{m.s}^{-1}\\ v_f&=0~\text{m.s}^{-1}\\ a&=-9.8 \text~\text{m.s}^{-2}\\ v_f&=v_i+at\\ \therefore t&=\displaystyle \frac{v_f-v_i}{a}\\ &=0.5~\text{s} \end{align*}[/latex]
Therefore, the total elapsed time is [latex]\scriptsize 1.01~\text{s} + 0.5~\text{s} = 1.51~\text{s}[/latex].
.
The velocity with which the ball first strikes the ground after the first bounce, due to time symmetry, is [latex]\scriptsize -4.95~\text{m.s}^{-1}[/latex]. Therefore, the initial velocity after the second bounce is [latex]\scriptsize \displaystyle \frac{4.95~\text{m.s}^{-1}}{2.48~\text{m.s}^{-1}}[/latex]. The ball bounces a second time after [latex]\scriptsize 1.51~\text{s} + 0.5~\text{s} = 2.01~\text{s}[/latex].
.
The max height reached by ball after the second bounce:
[latex]\scriptsize \begin {align*} v_i&=2.48~\text{m.s}^{-1}\\ v_f&=0~\text{m.s}^{-1}\\ a&=-9.8 \text~\text{m.s}^{-2}\\ {v_f}^2&={v_i}^2+2as\\ \therefore s&=\displaystyle \frac{{v_f}^2-{v_i}^2}{2a}\\ &=0.31~\text{m} \end{align*}[/latex]
.
The time taken for the ball to reach its maximum height after the second bounce:
[latex]\scriptsize \begin {align*} v_i&=2.48~\text{m.s}^{-1}\\ v_f&=0~\text{m.s}^{-1}\\ a&=-9.8 \text~\text{m.s}^{-2}\\ v_f&=v_i+at\\ \therefore t&=\displaystyle \frac{v_f-v_i}{a}\\ &=0.25~\text{m} \end{align*}[/latex]
.
Therefore, the total elapsed time is [latex]\scriptsize 2.01~\text{s} + 0.25~\text{s}= 2.26~\text{s}[/latex].
- Velocity vs time
- Acceleration vs time
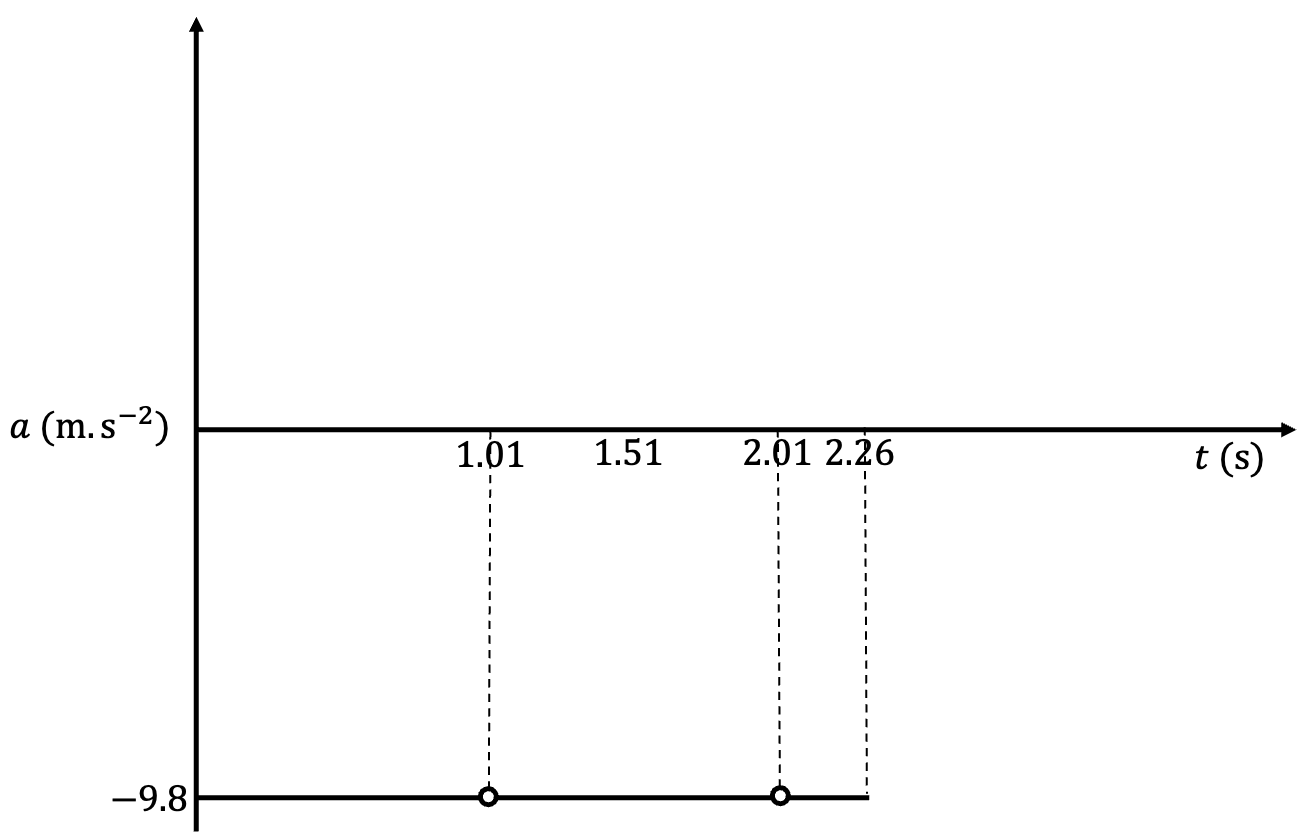
Note: When the ball bounces, it experiences a moment of great positive acceleration. We do not have enough information to determine what this is but for these very brief moments, the acceleration experienced by the ball is not that due to gravity. Therefore, we need to indicate this using open dots on the acceleration-time graph at these points in time.
- Let upwards be positive.
Unit 2: Assessment
- .
- .
[latex]\scriptsize \begin{align*} \text{Gravitational potential energy} &= mgh\\ &= 0.2~\text{kg}\times 9.8~\text{m.s}^{-2}\times 88~\text{m}\\ &= 172.48~\text{J} \end{align*}[/latex] - [latex]\scriptsize 0~\text{m.s}^{-1}[/latex]
- The displacement-time graph indicates that upwards is positive.
[latex]\scriptsize \begin {align*} v_i&=0~\text{m.s}^{-1}\\ t&=6.08~\text{s}-1.56\text{s}=4.52\text{s}\\ a&=-9.8 \text~\text{m.s}^{-2}\\ v_f&=v_i+at\\ &=-44.30~\text{m.s}^{-1} \end{align*}[/latex]
The stone’s velocity on hitting the ground is [latex]\scriptsize 44.30~\text{m.s}^{-1}[/latex] downwards. - The stone travels upwards for [latex]\scriptsize 1.56~\text{s}[/latex] before reaching its maximum height and having a velocity of [latex]\scriptsize 0~\text{m.s}^{-1}[/latex].
[latex]\scriptsize \begin {align*} v_i&=0~\text{m.s}^{-1}\\ t&=1.56~\text{s}\\ a&=-9.8 \text~\text{m.s}^{-2}\\ v_f&=v_i+at\\ \therefore v_i&=v_f-at\\ &=15.29~\text{m.s}^{-1} \end{align*}[/latex]
.
The velocity of the balloon at the moment the stone is released is [latex]\scriptsize 15.29~\text{m.s}^{-1}[/latex] upwards. - .
- .
Note
The motion of the stone in question 1 above may seem strange. How can a stone that is dropped travel upwards for a time before falling to the ground? This is possible only because the stone, at the moment of release, is travelling upwards with the hot-air balloon. It has an initial upwards velocity. As soon as the stone is released, acceleration due to gravity is the only force acting on the stone and it immediately begins to slow down. From the perspective of someone in the balloon, the stone will, therefore, seem to move downwards immediately. This is not the case, as the stone will keep moving up for a time but with an ever-decreasing velocity until it reaches its maximum height above the ground where its velocity is zero and it starts to fall towards the ground.
A very similar phenomenon happened when a Space Shuttle separated from its booster rockets (see figure 6). At the moment of separation, the booster rockets were travelling at the same speed as the Shuttle (about [latex]\scriptsize 1~280~\text{m.s}^{-1}[/latex]) and were [latex]\scriptsize 45~\text{km}[/latex] above the ground. However, because of their initial upwards velocity, the booster rockets continued to rise and reached a maximum height of [latex]\scriptsize 67 ~\text{km}[/latex] before starting to fall back to earth.

- .
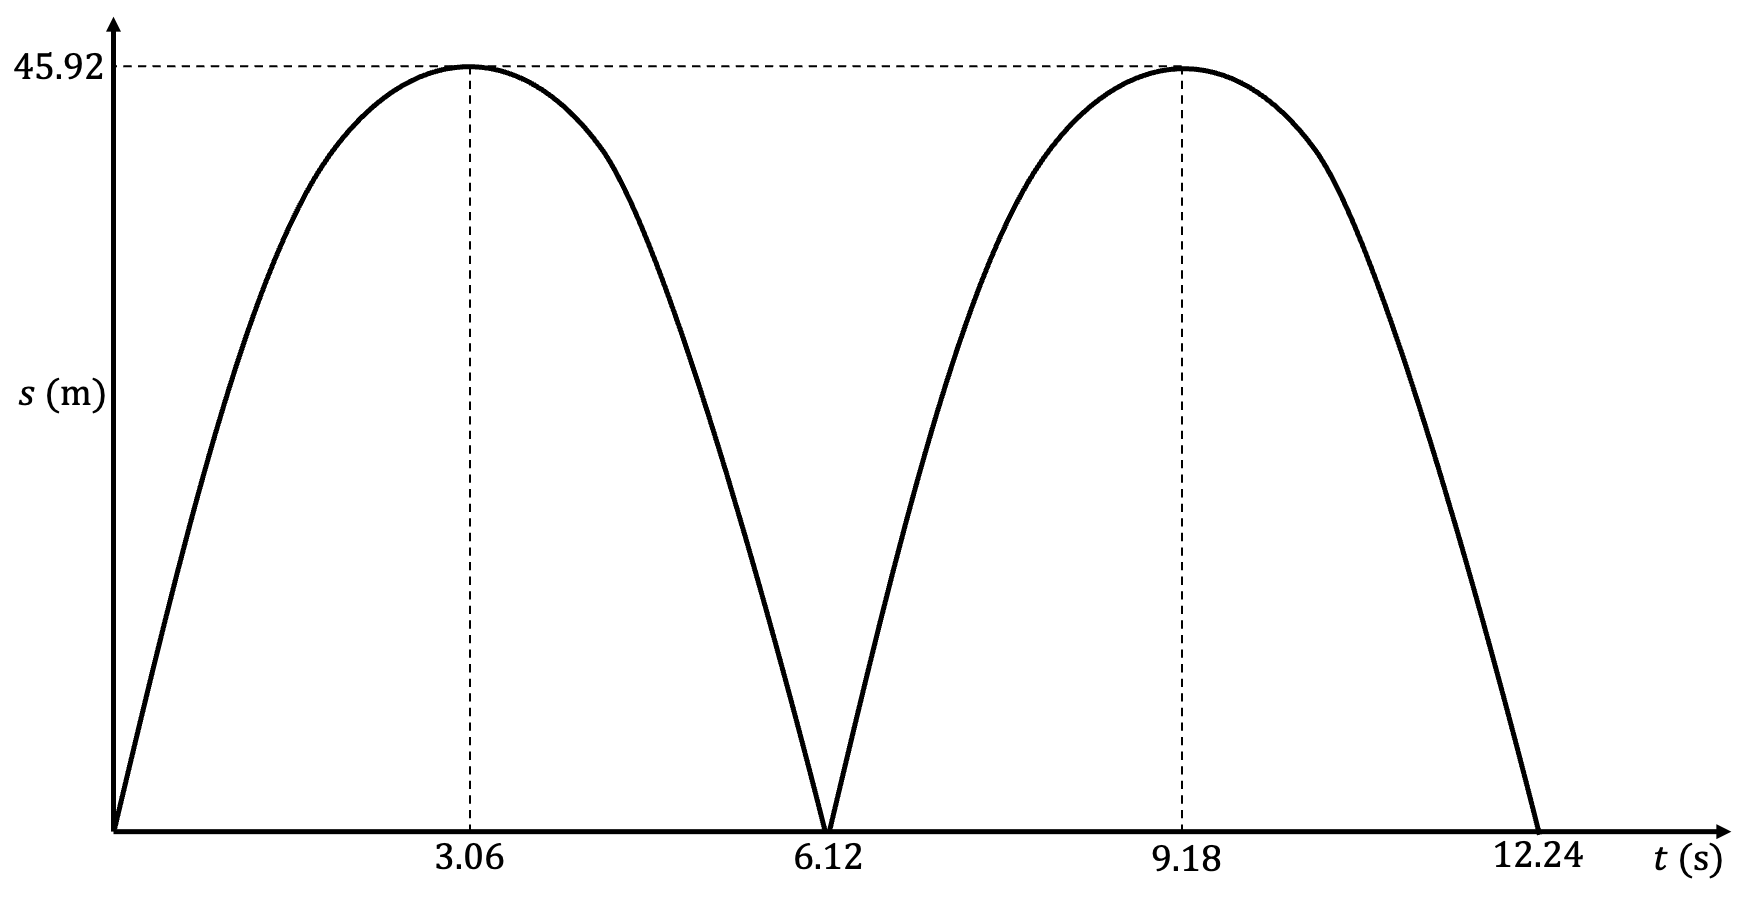
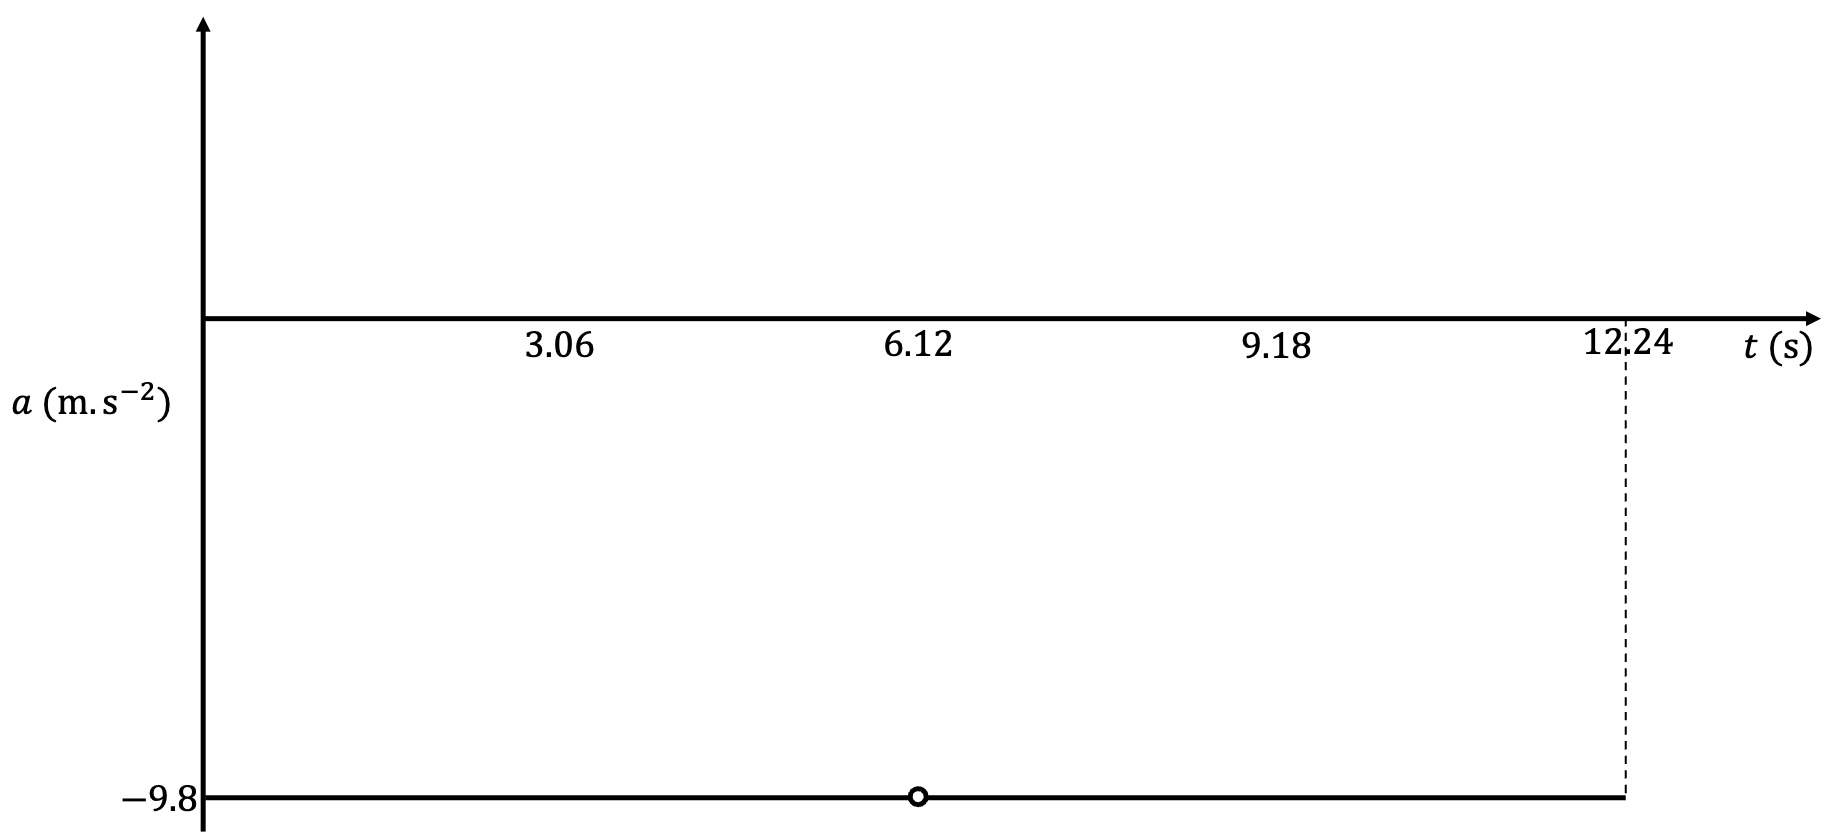
- The object has an initial velocity of [latex]\scriptsize 30~\text{m.s}^{-1}[/latex] upwards but is decelerating. After [latex]\scriptsize 3.06~\text{s}[/latex], its velocity is [latex]\scriptsize 0~\text{m.s}^{-1}[/latex] and then becomes negative indicating that at [latex]\scriptsize 3.06 s~\text{s}[/latex], the object reaches its maximum height and starts to accelerate downwards under gravity.
.
After another [latex]\scriptsize 3.06 ~\text{s}[/latex] (a total time of [latex]\scriptsize 6.12 ~\text{s}[/latex]) the object has achieved a negative (downwards) velocity of [latex]\scriptsize -30~\text{m.s}^{-1}[/latex] indicating that it is back at its original height. At this point, its velocity instantaneously changes to being [latex]\scriptsize 30~\text{m.s}^{-1}[/latex] again indicating that the object has bounced and travelled upwards again. After another [latex]\scriptsize 3.06 ~\text{s}[/latex] (a total time of [latex]\scriptsize 9.18 ~\text{s}[/latex]), the object has once again reached its maximum height and its velocity is again [latex]\scriptsize 0~\text{m.s}^{-1}[/latex]. The object starts to fall again and after another [latex]\scriptsize 3.06 ~\text{s}[/latex] (total time of [latex]\scriptsize 12.24 ~\text{s}[/latex]) it again has a downwards velocity of [latex]\scriptsize -30~\text{m.s}^{-1}[/latex] having reached its starting point again. - Maximum height reached by the object:
[latex]\scriptsize \begin {align*} v_i&=30~\text{m.s}^{-1}\\ v_f&=0~\text{m.s}^{-1}\\ a&=-9.8 \text~\text{m.s}^{-2}\\ {v_f}^2&={v_i}^2+2as\\ \therefore s&=\displaystyle \frac{{v_f}^2-{v_i}^2}{2a}\\ &=45.92~\text{m} \end{align*}[/latex]
.
- .
- The object has an initial velocity of [latex]\scriptsize 30~\text{m.s}^{-1}[/latex] upwards but is decelerating. After [latex]\scriptsize 3.06~\text{s}[/latex], its velocity is [latex]\scriptsize 0~\text{m.s}^{-1}[/latex] and then becomes negative indicating that at [latex]\scriptsize 3.06 s~\text{s}[/latex], the object reaches its maximum height and starts to accelerate downwards under gravity.
Media Attributions
- figure1 © DHET is licensed under a CC BY (Attribution) license
- figure2 © Geogebra is licensed under a CC BY-SA (Attribution ShareAlike) license
- figure3 © Geogebra is licensed under a CC BY-SA (Attribution ShareAlike) license
- figure4 © Geogebra is licensed under a CC BY-SA (Attribution ShareAlike) license
- figure5 © Geogebra is licensed under a CC BY-SA (Attribution ShareAlike) license
- example2.1A1 © Geogebra is licensed under a CC BY-SA (Attribution ShareAlike) license
- example2.1A2 © Geogebra is licensed under a CC BY-SA (Attribution ShareAlike) license
- example2.1A3 © Geogebra is licensed under a CC BY-SA (Attribution ShareAlike) license
- example2.2 © Geogebra is licensed under a CC BY-SA (Attribution ShareAlike) license
- example2.2A2 © Geogebra is licensed under a CC BY-SA (Attribution ShareAlike) license
- exercise2.1A1c © Geogebra is licensed under a CC BY-SA (Attribution ShareAlike) license
- exercise2.1Q1 © Geogebra is licensed under a CC BY-SA (Attribution ShareAlike) license
- assessmentQ1 © Geogebra is licensed under a CC BY-SA (Attribution ShareAlike) license
- assessmentQ2 © Geogebra is licensed under a CC BY-SA (Attribution ShareAlike) license
- exercise2.1A1b © Geogebra is licensed under a CC BY-SA (Attribution ShareAlike) license
- exercise2.1A2a © Geogebra is licensed under a CC BY-SA (Attribution ShareAlike) license
- exercise2.1A2b © DHET is licensed under a CC BY (Attribution) license
- exercise2.1A2c © DHET is licensed under a CC BY (Attribution) license
- assessmentA1e © Geogebra is licensed under a CC BY-SA (Attribution ShareAlike) license
- figure6 © SpawnV2 is licensed under a CC0 (Creative Commons Zero) license
- assessmentA2b © DHET is licensed under a CC BY (Attribution) license
- assessmentA2c © DHET is licensed under a CC BY (Attribution) license
